D1.1 Technology survey: Prospective and challenges - Revised version (2018)
4 ICT based systems for monitoring, control and decision support
4.12 Anomaly detection on smart sensors data used in water management
As IoT and Big Data processing technologies have experienced a rapid development, large sets of sensor data are gathered every day. These sets of captured data usually contain very useful and sometimes critical information, that is used in numerous services. For example, in hydroinformatics, the data provided by an IoT network can be used in flood management – e.g. a warning system for rising water levels. However, we must consider that, due to a mixture of reasons, sometime the sensor data has some anomaly. Thus, anomaly detection became a common problem in our days.
Anomaly detection is done using different machine learning algorithms or different heuristics rules. From the perspective of learning model there are three main categories techniques used for anomaly detection: unsupervised, supervised and semi-supervised anomaly detection. From the perspective in which detectors can differentiate abnormal from normal data [Sinwar, 2015] classified outliers’ detectors in four categories:
Statistical Distribution – Based Outlier detectors. This model assumes that data is distributed according with a probability model. A discordancy test is done for testing if an item is or not abnormal
Distance – based Outlier detectors. The distance-based methods are most preferred since human eyes can detect them easily
Density – based Outlier detectors. This approach is similar with distance based, the main difference is that the anomaly is detected in the local neighborhood. We may think about local neighborhood as the area nearest to the cluster boundary. Some clusters have a high density, while some are less dense. In the density-based method an object is considered outlier if it is in the neighborhood of a cluster whose density is very high. It might not be an outlier if the cluster is less dense.
Deviation – based Outlier detectors. These methods do not use the statistical tests or any distance-based metrics to identify outliers, instead they identify outliers based on their characteristics. The objects whose characteristics are different from the group are treated as outliers.
Also, depending on data characteristics there can be different approaches for detecting outliers: stationary data or non-stationary data. Data characteristics play a key role in defining the overall architecture. In the case of IoT systems, usually we are dealing with big streams of data, which sometimes need to be processed in real time.
In the following sections the main classes of anomaly detection techniques are briefly described.
Unsupervised anomaly detection. In this case, it is assumed that the majority records from the dataset is normal. Based on some metrics, rules or algorithms some items are distinguishable from the common data, so are considered abnormal (outliers). The labeling can rely on probabilities distributions or distance metrics. The accuracy is strongly dependent on dataset dimension and, on how balanced the data is. The big advantage of these techniques is that they are simple, easy to understand and usually very efficient.
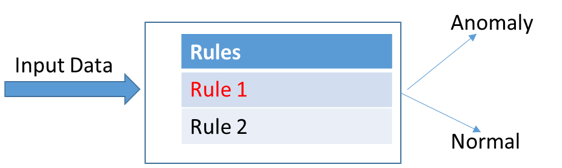
Heuristic/rule-based anomaly detection (see Fig. 15). This was the earliest anomaly detector. It was widely spread in the past because of its simplicity and efficiency. Together with the Subject Matter Expert, a set of rules which differentiate the normal behavior from the abnormal are established. The rules are then applied by a calculation device called anomaly detector. Such detectors are applied when the data complexity is not to high, when is easy to extract rules.
Figure 15. Heuristic/rule-based anomaly detection.
Clustering based anomaly detection. The idea behind this approach is to group the existing data into separate groups, called clusters. Once clustering is done, testing if a new instance is abnormal or not is equivalent with checking if the instance is part of a cluster or not. If it is too far for any of cluster it is considered abnormal otherwise is normal. Of course, for doing that, a representative number of instances is required. The data on which the clustering is done should be unbalanced.
The most common clustering algorithms used for anomaly detection are the following:
K-means algorithm. A number of K centroids are build based on a distance metric. The clusters have equal radius.
Expectation Maximization. Based on given d number and a probability distribution, d clusters are computed. The main difference between K-means is the fact that clusters didn’t have equal radius
K-NN. The label of a particular instance is given by the majority of the first k neighbors. If the label deduced using the algorithm is different from the real one is considered outlier otherwise is considered normal. The drawback of K-NN is the fact that requires that all the data should be always available in order to compute first K neighbors.
Such techniques are used especially in financial market, in political and social polls, in healthcare [Christya, 2015], but there are not optimized in determining the anomalies from sensor data. For this specific type of data, new adaptive, hybrid solutions were proposed. Such an example is Strider [Ren, 2017] that uses a mix of static (heuristic-based) and dynamic (cost-based) optimization approaches. Strider is an adaptive, inference-enabled distributed RDF stream processing engine that can be used to automatically detect anomalies in sensor data, i.e. observational data that is streaming in from sensors installed in a river, lake or an urban water system. This engine was introduced in the context of a water related project from France ([Waves FUI]), where it is used in processing data streams from sensors distributed over a potable water distribution network.
Supervised anomaly detection. The main difference between the unsupervised and the supervised techniques is the fact that data is previously labeled. Initially, data is labeled in two categories normal and abnormal. In the second phase a classifier is trained based on existing data. There are multiple classifiers used in practice: decision trees, support vector machines, ensemble learning, neural nets (deep learning). Any supervised learning algorithm has three phases: training, validation and testing. The accuracy is strongly dependent on dataset dimension and on how well the data is labelled. Usually, in practice analyzing and labelling the data is the most difficult phase. The labeling is done by the Subject Matter Expert. The big advantage of supervised anomaly detection is the fact that is considered being adaptive, it doesn’t require human intervention.
Anomaly detection based on logistic regression. Using logistic regression data is split in two categories normal and abnormal. The most widely used classifier is the logistic regression. The main condition for applying this technique is that data needs to be linearly separable. When is not satisfied, a way to fix it, is to derive new features from the existing one such that it becomes linearly separable.
Anomaly detection using support vector machines (SVM). Support vector machine is a very efficient machine learning algorithm. Compared with linear regression because it is an important step forward. Using different Kernels, it overcomes the linearly separable space condition. The idea behind the algorithm is to determine the boundary points, also called support vectors, of the two classes and then linearly separate them. There are several articles related to anomaly detection in the network intrusion field using SVM [Fisher, 2017], [Poomathy, 2017].
Decision Trees based anomaly detectors. Decision tree classification were widely used in practice because they are easy to understand and very intuitive. Based on the training set one or more decision trees are generated. The leaves represent the labels and the upper nodes have specific attribute conditions. The final classification is done by traversing the tree from the root to the leave. In the case of an anomaly detector the leaves have two values normal or abnormal. Algorithms like ID3, C4.5 developed by Quinlan were used in the past.
Now as the power of ensemble learning was discovered different decision trees-based algorithms appeared. Such techniques are now the best classifiers. Ensemble learning algorithms like Ada-Boost, XGBoost, Random Forest are implemented based on decision trees. They are winning almost all Kaggle competitions. In the training phase these algorithms require strong computation power. In Big-Data systems Random Forest is preferred because the training can be computed in parallel.
Of course, as long as they are very good classifiers they perform very well also as outlier detectors. Such detectors are very robust. The main problem with ensemble trees is the semantic gap. In a random forest or XGBoost algorithm the model resulted from training can contain hundreds of trees. The decisions made by the trained model are completely opaque from the human perspective.
Deep Learning - anomaly detectors. Deep learning is an edge case of ensemble learning. We can state that each neuron in a neural network is a weak learner. The efficiency of the algorithm is strongly dependent on the number of neurons. In the past because of the lack of computation power the implementation of neural nets with large numbers of neurons was physically impossible.
Any neural net is structured in different layers. Each layer has several neurons. The training phase is done using the backpropagation algorithm (back-propagating the gradient from the top layer to the bottom). Given a cost function we would like to determine the neurons weights which minimizes it. There are function optimizations procedures like Gradient-Descent, Adam, Ada-Grad, Nesterov, RMSProp [Ruder, 2017].
Since GPU’s development, starting with 2008, neural net classification become more and more attractive. Now in this area are written probably the most computer science articles. What in the past seemed to be impossible to classify, now is possible. Neural nets, using convolutional layers are used for edge detections (a case of outlier detection) with the same accuracy as human being. Also, IBM developed neural nets for detecting fraud detection. RNN architectures are also used for anomaly detections in time-series.
There are several deep learning frameworks available which supports learning on both CPU and GPU: TensorFlow [Géron, 2017], Caffe [Shelhamer, 2017], CNTK [Salvaris, 2018].
Semi-supervised anomaly detection. These techniques initially build a model which characterize normal behavior. Using this model other possible instances can be generated. To label a new item as being normal or abnormal is equivalent with checking the likelihood of that particular item to be generated by the model. If the likelihood is very small (is smaller than a threshold) it is considered abnormal otherwise is considered normal. These techniques were not commonly used in practice. They are strongly dependent on the pre-build model. This method is applied when there are not enough outliers available.
Outlier detection in time-series. All the above methods apply mainly to stationary data. By stationary data we mean data which doesn’t have local or global trends. For non-stationary data there are basically three main strategies:
Convert non-stationary data to stationary data. Once data becomes stationary we can use any of the methods presented above;
Create an outlier predictor based on transitory analysis done on a fixed window size;
Create a model able to predict the data. By comparing the prediction with the real outcome, we can decide if there is an outlier or not.
A. Converting non-stationary data to stationary. This step tends to be critical for many timeseries algorithm. Understanding the level of non-stationary gives you a strong insight of the data. There are two concepts: trend and seasonality. Trends are assimilated with the moving average. If the mean varies over time on a particular direction, then we have a trend. Similarly, if the data variation happens on a frequent window interval then we have a seasonality. We say that data is stationary when we have a constant mean, a constant variance and the autocovariance matrix does not depend on time.
B. Transitory analysis. For the transitory part a common approach is to use frequency analysis [Akyildiz, 2014].High activities on high frequency bands are quite unusual, even more when we are talking about physical parameters like temperature, pressure, etc. That’s why several outlier detectors are based on that. The problem is how to establish which behavior is normal and which is not. Usually this is based on specific thresholds. These thresholds can be computed analytically. To do so, first we apply a windowing transformation to our data.
Figure 16. Outliers Detector Scheme.
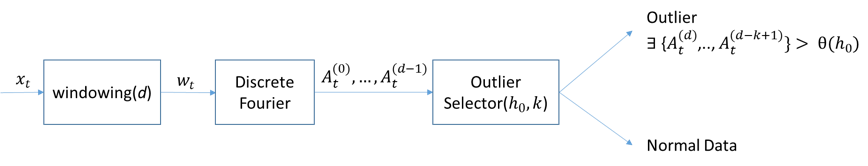
In fig. 16 it is presented the entire scheme of an Outliers Detector based on frequency analysis. The advantages of such detector are speed and clarity. It can be easily applied to big data streams and works in real time. On the other hand, is not so precise.
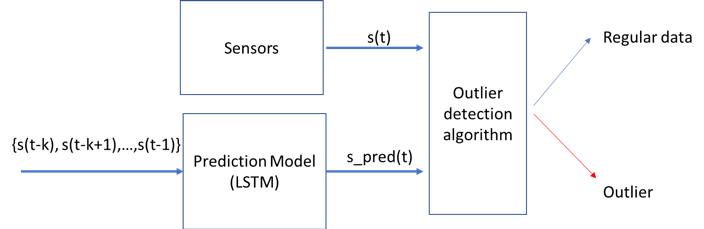
C. Timeseries predictions.Computing a model which predicts the timeseries is another way of detecting outliers. Having such a model we define an outlier detection algorithm based on comparing the observation with the predicted value.
Figure 17. Timeseries prediction Scheme.
Anomaly detector performance evaluation. There are many algorithms for anomaly detections, which perform good or bad depending on situation. The performance evaluation of an outlier detector is done based on several indicators and attributes used:
Precision, Recall, F-score. Number of false positives is also a critical indicator. Any anomaly detector should minimize this number. For example, an alert system that is feed with sensor data (an example of Outlier detection), having a big number of false positives is equivalent with unnecessary warnings or alerts which can destabilize the system functionality. This situation in real life is unacceptable.
Tunabilitycharacterize how our detector can support fine tuning to accommodate with different scenarios
Adaptiveis a property which characterizes detectors who can automatically adapt to data. For example, we would like our detector to take into consideration data seasonability and locality
Simplicity. A high complexity detector usually implies high cost for both implementation and administration. There are situations when infrastructure required for putting in practice a specific detector is too big and expensive and doesn’t have business justification.
Closing the semantic gap. In our days, there are many detectors based on ensemble learning or deep learning. Even if they are smarter than other sometime is very difficult to understand why they labeled a record as being abnormal. We would like to have hints which can explain to us how the decision was made
Speed. In many real scenarios the speed in which the detection is done is very important, especially when using sensitive hydrological data. This can make detector practical or unpractical. There are situations in which the anomaly detector should work in real-time. For example, in hydrology, if the system detects anomalies that could translate in flood, hurricanes or other natural disasters.
Distributed Systems for Outliers detection. In recent years several distributed systems were proposed for detecting outliers. Using Randomized Matrix Sketching method an outlier detector was designed on top of Apache Spark leveraging Apache Spark Streaming [Psarakis, 2017]. Based on K-means algorithm an outlier detector was designed on top of Apache Hadoop [Souzaa, 2015]. A distributed solution which use Local Outlier Factor (LOF) [Yan, 2017]. Twitter proposed a novel statistical learning algorithm for detecting outliers in timeseries. The method called Seasonal Hybrid ESD was applied in cloud on big streams of data [Hochenbaum, 2015]. RAD system used by Netflix. The algorithm is based on PCA. PCA uses the Singular Value Decomposition (SVD) to find low rank representations of the data. The robust version of PCA (RPCA) identifies a low rank representation, random noise, and a set of outliers by repeatedly calculating the SVD and applying “thresholds” to the singular values and error for each iteration.
The best outlier detector known today are using deep learning. Looking from this perspective the systems used/proposed were designed mainly to scale to huge loads of data, the focus not being on outliers’ detection quality.
An optimized solution for anomalies detection in time series data via deep learning algorithm is presented in [Kanarachos,2017]. This solution combines wavelets, neural networks, and Hilbert transform, in order to have long-term pattern interdependencies, that is usually a hard task to accomplish using standard neural network training algorithms. By comparison with the majority of the existing anomalies detection algorithms, their solution [Kanarachos,2017] targets the accurate and early detection of the anomalies, and not in the usual classification or determining the anomalies origin; and most importantly their solution does not require prior anomalies in the data. This aspect is very important when considering real life hydrological data, where anomalies are very rare, or data is too expensive to collect.