D1.1 Technology survey: Prospective and challenges - Revised version (2018)
This document presents a technology survey for smart data and services that support water management. The technology survey is elaborated by the UPB team in collaboration with the partner institutions from this project.
The survey consists of eight sections and the References. The first section, the Introduction, define the main concepts and terms that will be used in this documents, such as hydroinformatics. The second section, Data, describes the main research directions and challenges regarding data gathering, storing, processing and sharing for the Water Management systems. Several ICT technologies that support such management systems are described, such as streaming data analytics and MapReduce models. The third section is dedicated to Water Models. Two main paradigms for aquatic modelling are discussed here: physically-based and data-driven modelling. The next section provides an overview of the most performant ICT based systems that offers functionalities such as monitoring, control and decision support for the Water Management environment. Section five analyses the implications of worldwide non-government organizations in the water management field. Also, here the focus is on the citizen or community science in the context of the European community and, in particular, in Romania. Section six deals with specific standards needed for the hydroinformatics systems. This is an important topic due to the heterogeneity of the systems’ components. In Section 7, priority areas, challenges and research directions in FP7 and H2020 projects are discussed. A list with water related FP7 and H2020 projects is provides, along with their main objectives and topics. The last section provides future research directions and water related subjects that are correlated with the priority areas listed in HORIZON 2020.
| Site: | DATA4WATER |
| Course: | Deliverables |
| Book: | D1.1 Technology survey: Prospective and challenges - Revised version (2018) |
| Printed by: | Guest user |
| Date: | Thursday, 3 April 2025, 12:27 AM |
Table of contents
- 1 Introduction
- 2 Data
- 3 Water Models
- 4 ICT based systems for monitoring, control and decision support
- 4.1 Integrated Water Resource Management
- 4.2 Event-based monitoring of in stream processes
- 4.3 Technologies for near-real-time measurements, leakage detection and localization
- 4.4 Cloud Architecture – Datacenters and in-memory computing
- 4.5 Mobile Cloud computing
- 4.6 IoT trends and relation to Water Management
- 4.7 Fault tolerance - faults are the norm not the exception
- 4.8 Integrated approaches for watershed management
- 4.9 Information-centric systems (ICS) for watershed investigation and management
- 4.10 Supervisory control and data acquisition systems
- 4.11 Decision Support Systems
- 4.12 Anomaly detection on smart sensors data used in water management
- 4.13 Machine-to-Machine Model for Water Resource Sharing in Smart Cities
- 4.14 Reinforcement Learning for Water Management
- 5 Participatory / citizen science for water management
- 6 Secure Smart Water Solutions
- 7 Standards: INSPIRE and OGS
- 8 Priority areas, challenges and research directions in FP7 and H2020 projects
- 9 Further research directions
- 10 References
1 Introduction
This survey aims to identify and refine the research directions in ICT for Water Management, focused on the selected priority areas of HORIZON 2020. During the last couple of decades many topics from this filed have been addressed within the discipline known as Hydroinformatics. Therefore, the survey includes details about the results obtained so far in Hydroinformatics research, providing a comprehensive understanding of the current state of the art. Furtherrmore the survey focuses on smart data driven e-services in water resource management.
Hydroinformatics addresses the problems of aquatic environment with the purpose of proper water management by means of ICT. It integrates water data obtained from a large variety of sources, elaborates models, extracts knowledge about water, and offers the results to stakeholders. Water-related disciplines, such as hydraulics, hydrology, water quality and aquatic ecology are brought together with various ICT tools to ensure the whole information cycle in water management. This is primarily achieved by developing innovative integrated tools for data management, water modelling, forecasting and decision support. Hydroinformatics also recognizes the social aspects of water management problems, the challenges of decision making and stakeholder involvement when dealing with this shared resource. Increasingly the focus is on developing tools for integration of data, models, and people to support these complex water management challenges (see Journal of Hydroinformatics, What is Hydroinformatics and Hydroinformatics).
The structure of this survey follows the flow of information in Hydroinformatics systems. The first section is about data and refers to issues related to data sources, data processing (with focus on data uncertainty), and ICT support and technologies for data management (see Section 2).
The second section is dedicated to water modelling. After the presentation of the models categories, there is brief introduction of physically-based models, while the data driven models are discussed in more details (see Section 3).
Another section is an extended presentation of the state of the art in ICT based systems for monitoring, control, and decision support. Important topics related to advanced technologies for monitoring, near-real-time measurements, data storage and processing, integrated approaches for water resource management, decision support systems, and others are taken into account (see Section 4).
The analysis of participatory water management (see Section 5), several security solution for Smart Water domain (see Section 6) and of the standards used in the Hydroinformatics domain (see Section 7) are presented as well.
The survey is based on the ICT for Water Roadmap (2014 and 2015) documents published by participants to special sessions and Workshops on water management, which describe the challenges that need to be addressed in the ICT for water management sector and the open access initiative of EU (see Section 8).
In the final section, further research directions resulting from the survey are mentioned (see Section 9).
Disclaimer: The survey is a compilation of documents published by the members of the research team, as well as of published research results. The list of cited sources is available at the end of the document.
2 Data
The recent advances in satellite, sensor, automation, networking, and computation capabilities resulted in an ever-increasing avalanche of data and observations about the water systems. Thus we must use these data to build more accurate and integrated representations of these water systems.
Big Data implies large-volume with heterogeneous and diverse dimensionality, complex and growing data sets from multiple sources. With the fast development of solutions for efficient transfer, data collection capacity and storage, Big Data is now rapidly expanding in most of the engineering and science domains, including hydroinformatics (see Section 2.1).
One of the critical areas for management of water resources is hydrometry, a discipline under the hydro-science guiding protocols for data acquisition, processing, and delivering of quantitative estimation of the variables associated with the hydrological cycle (from rainfall to flow in rivers). Recently, the World Meteorological organization identified and implemented a standardized method for conducting uncertainty analysis using rigorous and robust approaches [Muste, 2012] (see Section 2.2).
According to the World Economic Forum [Global Risk, 2015], the International Energy Agency projects water consumption will increase by 85% by 2035 to meet the needs of energy generation and production. Global water requirements are projected to be pushed beyond sustainable water supplies by 40% by 2030. Also, nowadays utilities collect millions of pieces of data each day. This asks for finding new methods and technologies to efficiently process and use this data, and to build more accurate and integrated representations of smart water systems (see Section 2.3).
2.1 Data sources
Water data are permanently collected from a variety of sources. Primary data sources are established water monitoring networks commonly maintained by government agencies responsible for the hydrological, meteorological or geological services. For urban water systems such monitoring networks are maintained by responsible water utilities. Further to these ‘standard’ data sources there is an increased availability of other, more heterogeneous data sources: flood marks, sensors, open data sites and data repositories, smart phones, reports, citizens, etc. Smart phones have important advantages: they are equipped with physical sensors such as pedometers, breath analysers, accelerometers, image analysers, etc.; are attached to humans and can collect information from different locations; are increasingly becoming transmitters of human-sensed data. The field of ICT for water has the challenge of merging these different water data sources in new applications that will deliver additional value to the end users.
Water data refer to different aspects, which depend on the applications’ requirements: water quantity, quality, rainfall, movement of water within the soil, groundwater movement, pollution, etc. In urban water systems, data refer to water pressure, energy consumption, water quality and others.
Data can have different formats; data can be structured (such as those collected from sensors) or unstructured (e.g. textual data received in social networks). Many water data are time series. Data can also be related, meaning that two variables can have a functional relationship.
Water systems (geological units, rivers, lakes, soil distribution, precipitation) are distributed in space. So, water data are related to the spatial context and, implicitly with the geographical information and GIS (Geographical Information Systems). GIS has a broader scope, and covers not only the water “world” but also the transportation, urban planning, and others. GIS data are available from various sources, in different formats and with different sharing policies. These are in fact very similar issues to the water data. To deal with these challenges the GIS community has recently developed standards for sharing spatial data, primarily within the Open Geospatial Consortium (OGC – see Section 6.2). This community also developed the concept of SDI (Spatial Data Infrastructure) that supports easy deployment, discovery and access to geospatial data. These developments are very relevant for the water domain. In fact, other standards for different types of water data (such as WaterML, for sharing time series data, for example) are being developed within OGC. However, while the progress with developing and establishment of new data standards continues, new challenges emerge with respect to the effective usage of the new, heterogeneous data coming from the ‘non-standard’ sources mentioned above.
2.2 Uncertain data
Uncertainty in measurements arises due to randomness and complexity of physical phenomena and errors in observations and/or processing of the measured data. There is also a need for users of one discipline to understand the uncertainty of the data and products from another discipline prior to using them and that the methodology used in uncertainty estimation is consistent. Finally, there is also the benefit to various communities such as the public when seeing the uncertainty expressed for data and products of various disciplines (see Uncertainty analysis).
There are 160 standards related to the scope of UA issued by various ISO technical committees, which can be structured in three types: General UA, Flow Measurement UA, and Specific Flow Measurement UA (see Standards related to the scope of UA).
Uncertainty sources involve the following classes:
- variables that are used (i.e., instruments, protocols, design site and flow characteristics);
- spatial changes in the stream cross section due to the presence of bed forms, vegetation, and ice/debris presence;
- temporal changes in the flow due to backwater, variable channel storage, and, unsteady flows (see Uncertainty sources).
The implementation of the UA assumes that the uncertainties involved are small compared with the measured values, with the exception being when the measurements are close to zero (see Practical Considerations).
Uncertainty analysis [top]
Uncertainty analysis is a rigorous methodology for estimating uncertainties in measurements and in the results calculated from them combining statistical and engineering concepts. The objective of a measurement is to determine the value of a measurand that is the value of the particular quantity to be measured. A measurement for a specified measurand therefore entails the measurement methods and procedures along with the effect of the influence quantities (environmental factors). In general, a measurement has imperfections that give rise to an error in the measurement result. Consequently, the result of a measurement is only an approximation or estimate of the value of the measurand and thus is complete only when accompanied by a statement of the uncertainty of that estimate. In practice, the required specification or definition of the measurand is dictated by the required accuracy of measurement. The accuracy of a measurement indicates the closeness of agreement between the result of a measurement and the value of the measurand.
The measurement error is defined as the result of a measurement minus a true value of the measurand. Neither the true value nor the value of the measurand can ever be known exactly because of the uncertainty arising from various effects.
In typical measurement situations, several physical parameters (e.g., flow velocity, depth, and channel width) are physically measured to obtain a derived quantity (e.g., stream discharge). The individual physical measurements are then used in a data reduction equation (e.g., velocity–area method) to obtain the targeted value. Consequently, the two major steps involved in the uncertainty analysis are:
- identification and estimation of the uncertainties associated with the measurement of the individual variables, and
- propagation of the individual measurement uncertainties in the final result.
While the methods for estimation of the elemental sources of uncertainty are quite similar among various communities (statistical analysis or use of previous experience, expert opinion, and manufacturer specifications), the methods used to determine how those sources of uncertainty are accounted for in the final result have differed widely [TCHME, 2003]. In addition, variations can even occur within a given methodology. Coleman and Steele [Coleman, 1999] discuss six different variations of the Taylor series expansion estimation method (which is the most used uncertainty-estimation approach for the propagation of uncertainties).
Uncertainty analysis is a critical component of the assessment of the performance of the flow measurement and techniques for both the conventional and newer instrumentation and methodologies. These analyses are of fundamental importance to the application of risk management procedures and sustainable water resources management, by ensuring that the methodology and instrumentation selected for a task will deliver the accuracy that is needed. These analyses would also enable investments in hydrological instrumentation in the most cost-effective manner.
Standards related to the scope of UA [top]
Given the vast amount of publications on the topic, a recent overview of the flow measurements standards issued by the International Standards Organization (ISO – the most authoritative institution in the area of standards) lists about 160 standards related to the scope of UA issued by various ISO technical committees, that can be structured in three types of Uncertainty Analysis (UA) publications (i.e., frameworks, standards, guidelines, or references):
- General UA (GUA)
- Flow Measurement UA (FMUA), and
- Specific Flow Measurement UA (SFMUA).
General UA (GUA) approaches
UA was a major concern of scientists and practitioners, as well as of the standardization bodies. In 1986, the efforts of the American Society of Mechanical Engineers (ASME) led to the adoption of the ASME-PTC 19.1 Measurement Uncertainty standard [ASME, 1986], that was recognized also by: the Society of Automotive Engineers (SAE); the American Institute of Aeronautics and Astronautics (AIAA); ISO; the Instrument Society of America – currently the Instrumentation, Systems, and Automation Society (ISA); the US Air Force, and the Joint Army Navy NASA Air Force (JANNAF).
In parallel, due to intense international debates and lack of consensus, in 1978, the problem of unified approach of the uncertainty in measurements was addressed, by the Bureau International des Poids and Mesures (BIPM), at the initiative of the world’s highest authority in metrology, the Comité International des Poids et Mesures (CIPM), and a set of recommendation was elaborated. Eventually, the diverse approaches coagulated by ISO that assembled a joint group of international experts representing seven organizations: BIPM, ISO, International Electrotechnical Commission (IEC), International Federation of Clinical Chemistry (IFCC), International Union of Pure and Applied Chemistry (IUPAC), International Union of Pure and Applied Physics (IUPAP), and International Organization of Legal Metrology (OIML) that prepared the “Guide to Expression of Uncertainty in Measurement” [GUM, 1993], the first set of widely internationally recognized guidelines for the conduct of uncertainty analysis.
GUM provides general rules for the evaluation and expression of uncertainty in measurement rather than providing detailed and specific instructions tailored to any specific field of study. The main distinction between GUM and previous methods is that there is no inherent difference between an uncertainty arising from a random effect and one arising from a correction for a systematic effect (an error is classified as random if it contributes to the scatter of the data; otherwise, it is a systematic error). GUM uses a classification based on how the uncertainties are estimated:
- Type A - evaluated statistically;
- Type B (evaluated by other means).
GUM provides a realistic value of uncertainty based on standard’s methodology fundamental principle that all components of uncertainty are of the same nature and are to be treated identically. GUM / JCGM (100:2008) methodology is recognized today as being the most authoritative framework for a rigorous uncertainty assessment, however, it provides general rules for evaluating and expressing uncertainty in measurement rather than providing detailed, scientific- or engineering-specific instructions. GUM / JCGM (100:2008) does not discuss how the uncertainty of a particular measurement result, once evaluated, may be used for different purposes such as, for example, to draw conclusions about the compatibility of that result with other similar results, to establish tolerance limits in a manufacturing process, or to decide if a certain course of action may be safely undertaken.
Flow Measurement UA (FMUA) and Specific FMUA (SFMUA) approaches
Minimal guidance is available on UA for flow measurements [WMO, 2007]; Pilon et al., 2007). A new edition of the Guide to Hydrological Practices recently published in 2008 [WMO, 2008] reviews new instrumentation and technologies to produce hydrological information but does not address uncertainty analysis aspects of the data and information. Despite the many authoritative documents on flow measurement that were available (e.g., [ASME, 1971]), the first effort at developing a national standard for flow measurement in the U.S.A. was initiated in 1973 [Abernethy, 1985]. The first standard on flow measurement developed by ISO was “Measurement Flow by Means of Orifice Plates and Nozzles” [ISO, 1967] and is based on compromises between USA procedures and those in use throughout Western Europe. All of these efforts addressed the accuracy of flow measurement with various degrees of profundity. However, each of the resulting publications reported “personalized” procedures for estimating the uncertainty and was often biased by the judgment of the individuals involved in the development of procedure development [Abernethy, 1985].
Because of the diversity and large number of available standards on flow measurements (there are 64 ISO standards), guidance on the different types of standards (how they can be used and when), the decision process for implementation of standards, the various key access points for information about the standards and their availability is necessary. ISO/TR 8363 [ISO, 1997] is recommended as being the “standard of the standards” for flow measurements as it gives the most qualified guidance on the selection of an open channel flow measurement method and in the selection of an applicable standard. The first criterion that the ISO (1997) uses to select a specific flow measurement instrument or technique is the required or expected level of uncertainty of the measurement.
Uncertainty sources [top]
The estimation of the uncertainties of the stream-flow estimates at gaging station based on rating curves associated with the HQRC and IVRC methods involves two distinct aspects:
- the estimation of the accuracy of the direct measurements for constructing and subsequently using the RCs, and
- the estimation of the accuracy of the RCs themselves (i.e., regression, extrapolation, shifting).
Similarly, the CSA method is subject to uncertainty from the direct measurements and from the analytical methods and their assumptions.
Using the generic grouping of the sources of uncertainties in gaging methods proposed by [Fread, 1975], we can distinguish the following classes:
- variables that are used (i.e., instruments, protocols, design site and flow characteristics)
- spatial changes in the stream cross section due to the presence of bed forms, vegetation, and ice/debris presence. These changes are typically evolving slower in time (from storm event to season duration) and can be reversible or permanent.
- temporal changes in the flow due to backwater, variable channel storage, and, unsteady flows. Typically, these changes are of the order of hours or days.
Assessment of the individual sources of uncertainties in the three categories above is not available from several reasons:
- there is no comprehensive and widely accepted methodology to conduct uncertainty analysis (UA) for hydrometric measurements at this time. Efforts are made in this community to identify robust standardized methodologies for the assessment of uncertainties for both direct measurements (e.g., [Muste, 2012]) and rating curves (e.g., [Le Coz, 2014]). These efforts are quite extensive as conduct of UA requires specialized experiments similar to the calibrations executed by manufacturers for industrial flow meters. Obviously that these calibrations are much more difficult to conduct in field conditions.
- the level of uncertainty in the HQRC, IVRC, and CSA method estimates induced by site conditions and changes in the flow status are un-known. The situation is especially critical for high flows (e.g., floods) as these events are not frequent and the preparation to acquire measurements are more involved than in steady flows.
Despite the challenge and high cost, these efforts are currently increased as the demand for data quality is also increasing [Le Coz, 2015], [Muste, 2015].
The same method generates different results, depending on the evolution of physical related phenomena. Thus for steady flows, the analysis HQRC vs. IVRC, the findings presented in [Muste, 2015] might suggest that the IVRC estimates are less precise (i.e., show more scattering) than HQRC estimates in steady flows.
Another aspect that distinguishes the IVRC from HQRC is that the former method is sensitive to the change in the flow structure passing through the line of sight.
To compare the performance of HQRC vs. CSA, studies were conducted at the USGS streamgage station 05454220 located on Clear Creek, a small stream located in Iowa, USA. The differences between the two curves are up to 20% for this site (differences are site specific), indicating that the less expensive (no calibration needed) synthetic RC can be used as surrogates when lack of re-sources are of concern for the monitoring agencies. Moreover, the increased availability of affordable radar- or acoustic-based sensors that non-intrusively measure the free surface elevation makes this simplified SA approach attractive for a plethora of applications where this degree of uncertainty is acceptable.
Unsteady flows are ephemeral but unavoidable in natural streams, therefore hysteresis is always present to some degree irrespective of the river size.
It is often stated that for most of the streams the hysteresis effects are small and cannot be distinguished from the uncertainty of the instruments and methods involved in constructing the RCs. On the other hand, theoretical considerations leave no doubt that the use of HQRCs for unsteady flows is associated with hysteresis, however small it may be [Perumal, 2014]. It is only by acquiring direct discharge measurements continuously during the whole extent of the propagation of the flood wave, as it is done in the present study, that it can be demonstrated the magnitude of the hysteresis effect. Fortunately, the advancement and efficiency of the new measurement technologies makes this task increasingly possible.
The non-unicity of the relationships flow variables during unsteady flows were also observed in detailed laboratory experiments conducted by Song and Graf [Song, 1996] where it was shown that during the passage of the hydrograph the mean cross-sectional velocities on the rising limb are larger than on the falling limb for the same flow depth. Unfortunately, this level of detail for the analysis cannot be easily achieved in field conditions.
The experimental evidence [Muste, 2013] suggests that recourse needs to be made to the fundamental equations for the unsteady open channel flow (e.g., Saint-Venant equations) when formulating protocols for IVRC method. The correction protocols would be similar to the corrections applied for the HQRC protocols used in unsteady flows. Another alternative for enhancing the performance of IVRC for unsteady flow would be to use the segmentation approach described by Ruhl and Simpson [Ruhl, 2005] in the construction of the curve for unsteady flows.
The comparison of the CSA vs HQRC [Muste, 2015] allows to note that on the rising limbs of the CSA method, the high flows occur faster and are larger than those predicted by the HQRC method. These findings are consistent with previous laboratory and field measurements (e.g., [Song, 1996]; [Perumal, 2004]; [Gunawan, 2010] and have practical implications for both flood and stream transport processes.
The main conclusions on the performance of the conventional methods in observing steady flows [Muste, 2015] is that the HQRC method is more robust and less sensitive to the changes in flow structures (produced by imperfections in the gaging site selection and ephemeral changes in the flow distribution) compared to IVRC and simplified CSA methods. In contrast, the HQRC performs poorer than the other methods in unsteady flows as the typical construction protocol for RCs is based on steady flow assumptions.
Many distributed systems use the event-driven approach in support of monitoring and reactive applications. Examples include: supply chain management, transaction cost analysis, baggage management, traffic monitoring, environment monitoring, ambient intelligence and smart homes, threat / intrusion detection, and so forth.
Events can be primitive, which are atomic and occur at one point in time, or composite, which include several primitive events that occur over a time interval and have a specific pattern. A composite event has an initiator (primitive event that starts a composite event) and a terminator (primitive event that completes the composite event). The occurrence time can be that of the terminator (point-based semantics) or can be represented as a pair of times, one for the initiator event, and the other for the terminator event [Paschke, 2008, Dasgupta 2009]. The interval temporal logic [Allen, 1994] is used for deriving the semantics of interval based events when combining them by specific operators in a composite event structure.
Event streams are time-ordered sequences of events, usually append-only (events cannot be removed from a sequence). An event stream may be bounded by a time interval or by another conceptual dimension (content, space, source, certainty) or be open-ended and unbounded. Event stream processing handles multiple streams aiming at identifying the meaningful events and deriving relevant information from them. This is achieved by means of detecting complex event patterns, event correlation and abstraction, event hierarchies, and relationships between events such as causality, membership, and timing. So, event stream processing is focused on high speed querying of data in streams of events and applying transformations to the event data. Processing a stream of events in their order of arrival has some advantages: algorithms increase the system throughput since they process the events “on the fly”; more specific they process the events in the stream when they occur and send the results immediately to the next computation step. The main applications benefiting from event streams are algorithmic trading in financial services, RFID event processing applications, fraud detection, process monitoring, and location-based services in telecommunications.
Temporal and causal dependencies between events must be captured by specification languages and treated by event processors. The expressivity of the specification should handle different application types with various complexities, being able to capture common use patterns. Moreover, the system should allow complete process specification without imposing any limiting assumptions about the concrete event process architecture, requiring a certain abstraction of the modelling process. The pattern of the interesting events may change during execution; hence the event processing should allow and capture these changes through a dynamic behaviour. The usability of the specification language should be coupled with an efficient implementation in terms of runtime performance: near real-time detection and non-intrusiveness [Mühl, 2006]. Distributed implementations for the events detectors and processors often achieve these goals. We observe that, by distributing the composite event detection, the scalability is also achieved by decomposing complex event subscriptions into sub-expressions and detecting them at different nodes in the system [Anicic, 2009]. We add to these requirements the fault tolerance constraints imposed to the event composition, namely: the correct execution in the presence of failures or exceptions should be guaranteed based on formal semantics. One can notice that not all these requirements can be satisfied simultaneously: while a very expressive composite event service may not result in an efficient or usable system, a very efficient implementation of composite event detectors may lead to systems with low expressiveness. In this chapter, we describe the existing solutions that attempt to balance these trade-offs.
Composite events can be described as hierarchical combinations of events that are associated with the leaves of a tree and are combines by operators (specific to event algebra) that reside in the other nodes. Another approach is continuous queries, which consists in applying queries to streams of incoming data [Chandrasekaran, 2002]. A derived event is generated from other events and is frequently enriched with data from other sources. Event representation must completely describe the event in order to make this information usable to potential consumers without need to go back to the source to find other information related to the event.
Many event processing engines are built around the Event, Condition, Action (ECA) paradigm [Chakravarthy, 2007], which was firstly used in Data Base Management Systems (DBMS) and was then extended to many other categories of system. These elements are described as a rule that has three parts: the event that triggers the rule invocation; the condition that restricts the performance of the action; and the action executed as a consequence of the event occurrence. To fit this model, the event processing engine includes components for complex event detection, condition evaluation, and rule management. In this model, the event processing means detecting complex events from primitive events that have occurred, evaluating the relevant context in which the events occurred, and triggering some actions if the evaluation result satisfies the specified condition. Event detection uses an event graph, which is a merge of several event trees [Chakravarthy, 1994]. Each tree corresponds to the expression that describes a composite event. A leaf node corresponds to a primitive event while intermediate nodes represent composite events. The event detection graph is obtained by merging common sub-graphs. When a primitive event occurs, it is sent to its corresponding leaf node, which propagates it to its parents. When a composite event is detected, the associated condition is submitted for evaluation. The context, which can have different characteristics (e.g. temporal, spatial, state, and semantic) is preserved in variables and can be used not only for condition evaluation but also in action performance.
Studies emphasize the strong dependence on the test location. The findings are in agreement with theoretical considerations and consistent with a handful of previous studies of similar nature. The existing studies point out that there is a need for initiating a systematic effort to evaluate the effect of flow unsteadiness on various types of RCs used at gages located in medium and small streams. Fortunately, this task is considerable eased nowadays by the availability of the new generation of non-intrusive (i.e., optical and image based) instruments that can be used to programmatically target monitoring of flood events throughout their duration.
Practical Considerations [top]
The implementation of the UA assumes that the uncertainties involved are small compared with the measured values, with the exception being when the measurements are close to zero. For this to be true, the following have to be carefully made [AIAA, 1995]; [GUM, 1993]:
- the measurement process is understood, critically analysed, and well defined
- the measurement system and process are controlled
- all appropriate calibration corrections have been applied
- the measurement objectives are specified
- the instrument package and data reduction procedures are defined
uncertainties quoted in the analysis of a measurement are obtained under full intellectual honesty and professional skills.
If all of the quantities on which the result of a measurement depends are varied, its uncertainty can be evaluated by statistical means (Type A evaluation method). However, because this is rarely possible in practice due to limited time and resources, the uncertainty of a measurement result is usually evaluated using a mathematical model of the measurement and the law of propagation of uncertainty. Thus implicit in GUM / JCGM (100:2008) is the assumption that a measurement can be modelled mathematically to the degree imposed by the required accuracy of the measurement. Because the mathematical model may be incomplete, all relevant quantities should be varied to the fullest practical extent so that the evaluation of the uncertainty can be based as much as possible on observed data.
The implementation of the Guide assumes that the result of a measurement has been corrected for all recognized significant systematic effects and that every effort has been made to identify such effects. In some case, the uncertainty of a correction for a systematic effect need not be included in the evaluation of the uncertainty of a measurement result. Although the uncertainty has been evaluated, it may be ignored if its contribution to the combined standard uncertainty of the measurement result is insignificant. In order to decide if a measurement system is functioning properly, the experimentally observed variability of its output values, as measured by their observed standard deviation (end-to-end approach in the AIAA, 1005 terminology), is often compared with the predicted standard deviation obtained by combining the various uncertainty components that characterize the measurement. In such cases, only those components (whether obtained from Type A or Type B evaluations) that could contribute to the experimentally observed variability of these output values should be considered.
It is recommended that a preliminary uncertainty analysis be done before measurements are taken. This procedure allows corrective action to be taken prior to acquiring measurements to reduce uncertainties. The pre-test uncertainty analysis is based on data and information that exist before the test, such as calibration, histories, previous tests with similar instrumentation, prior measurement uncertainty analysis, expert opinions, and, if necessary, special tests. Pre-test analysis determines if the measurement result can be measured with sufficient accuracy, to compare alternative instrumentation and experimental procedures, and to determine corrective actions. Corrective action resulting from pre-test analysis may include:
- improvements to instrument calibrations if systematic uncertainties are unacceptable
- selection of a different measurement methods to obtain the parameter of interest
- repeated testing and/or increased sample sizes if uncertainties are unacceptable
Cost and time may dictate the choice of the corrective actions. If corrective actions cannot be taken, there may be a high risk that test objectives will not be met because of the large uncertainty interval, and cancellation of the test should be a consideration. Post-test analysis validates the pre-test analysis, provides data for validity checks, and provides a statistical basis for comparing test results.
2.3 ICT support and technologies for data management
A large variety of heterogeneous physical devices are used to collect water related data. Their connection with other components of the hydroinformatics platforms uses several technologies, the most recent one being the Internet of Things. This approach ensures the integration of data sources in the Internet by associating a unique identifier with each device and a semantic communication with other Internet components. IoT is already used in water related applications (see The role of IoT in sensing and communication).
Usually, data are received in real-time from the source and are most valuable at the time of arrival. This is why the analytics that process in real time large-scale stream data are used in many water related applications (see Streaming data analytics).
Pre-processing is essential in the data pipeline system because it takes an input of uncertain, missing or error-prone data and transforms it into reliable information. This can be done to filter and eliminate useless data or simply to reduce the overall amount of data that needs to be analysed. The most important aspect of data cleaning refers to the cleaning of time-series. This data is usually produced by sensors, which monitor different parameters of water flow or water consumption. Regression models exploit continuity and correlations between different sampling processes. The dependency of one variable (e.g. time) is computed to another (sensor values) in order to build a regression curve, which is then used as the standard (see Data cleaning).
Today the Internet represents a big space where great amounts of information are added every day. Large datasets of information is indisputable being amassed as a result of our social, mobile, and digital world. We are not far from the time when terms like PetaByte, ExaByte, and ZettaByte will be quite common. However, in the Big Data era, storing huge amounts data is not the biggest challenge anymore. Today researchers struggle with designing solutions to understand the Big amount of Data available. Efficient parallel/concurrent algorithms and implementation techniques are the key to meeting the scalability and performance requirements entailed by scientific data analyses. Challenges such as scalability and resilience to failure are already being addressed at the infrastructure layer. Applications need fast movement and operations on that data, not to mention support to cope with an incredible diversity of data. Big data issues also emerge from extensive data sharing, allowing multiple users to explore or analyses the same data set. All these demand a new movement - and a new set of complementary technologies. Big Data is the new way to process and analyse existing data and new data sources (see Processing, storing, and sharing large amount of data).
Up until recently Google, Amazon and Microsoft were the main actors capable to handle big data, but today new actors enter the Big Data stage. At the forefront, Google uses one of the largest dataset to discover interesting aspects to improve their services. MapReduce, their novel computing model, provoked the scientists to rethink how large-scale data operations should be handled (see MapReduce programing model).
Later on, the MapReduce community is migrating high-level languages on top of the current interface to move such functionality into the run time (see Other solutions related to MapReduce).
Sharing the data is another challenge for Big Data applications, besides processing. With all the BigData tools and instruments available, we are still far from understanding all the complexities behind processing large amounts of data (see Sharing the data).
The role of IoT in sensing and communication [top]
Internet of Things (IoT) is a network connecting together diverse physical devices, from sensors, to actuators, vehicles and even buildings. It proposes new methods to connect and access information using device2device communication protocols, developing paradigms such as smart objects, and the addressing to devices over Web services. More recently, IoT was introduced as an infrastructure for collecting data from the most diverse kind of devices in water monitoring applications, and dealing with the analyse of information over specialized IoT platforms such as InfluxData. Several examples of applications of IoT in water management stand up:
- Smart irrigation with IoT: Smart irrigation replaces existing irrigation controllers (which are just simple timers), with cloud enabled smart irrigation controllers that apply water based on plant need (i.e., type of crop) and weather. Moreover, with flow sensors and real-time alerts, property managers and landscape contractors can be alerted the second something goes awry, which if your site has any significant landscape at all, you know this can happen quite frequently. Examples of such systems: HydroPoint’s WeatherTRAK® smart irrigation system.
- Smart water meters with IoT: A smart water meter (device) can collect usage data and communicate it wirelessly to the water utility company, where analytics software reports the results on a web site to view. Examples of such systems: One of the largest pilot programs of smart meters and related water management software platforms (a smart water management network) is in San Francisco. Water consumption is measured hourly and data is transmitted on a wireless basis to the utility four times a day. Both the utility and customers can track use. A pilot program in the East Bay Municipal Water District, which targets mostly single-family homes, provides a daily update of hour-by-hour consumption via a website. Consumers can be alerted, for example, by email or phone call, when water use exceeds a specified limit or when a meter indicates continuous running water for 24 hours. A customer can further view the data as it comes in, as well as compare their numbers with past use and city averages. The usage data should eventually result in alerts for leaks (by comparing how the readings in consecutive water meters).
Determining water demand in a city: One of the crucial challenges of water management as well as conservation in a city is to determine the amount of water that any particular city is going to utilize during the next day. This can be calculated to precision with the use of predictive analytics. Recently, IoT was employed for this purpose, where dedicated platforms keep a track on the history of water consumption in the city on any given day. Based on the historical data collected and analysed by predictive analytics and combined with the consideration of special events, holidays, as well as the weather in that city, we can determine the amount of water that the entire population is going to consume in one day. The Internet of Things technology also helps in scheduling the maintenance as well as shutdown of pumps on a regular basis. There are optimization techniques, which can beforehand convey to the residents of a city regarding the unavailability of water during any particular point of time. This helps the water regulation authorities in not only meeting the adequate water demands in a city; rather it also aids in the conservation of resources and energy.
Streaming data analytics [top]
Processing and reasoning must be done in a real-time fashion. Efficient methods for streaming need to be considered as well as robust algorithms that must analyse the data in one pass since it is usually not possible to store the entire history of data. For example, applications that trigger alerts are time-sensitive and the time of response may be significantly influenced by the large number of monitored devices.
When considering Big Data analytics most of the data is received in real-time and is most valuable at the time of arrival. This is the main motivation behind the increased interest in the field of large-scale stream processing. Some of the earliest academic systems to handle streaming-data analytics were Aurora, STREAM, Borealis and Telegraph. They first introduced the concepts of sliding windows and incremental operators.
One of the major innovations of this field is the ability to run continuous queries that produce different results as new data arrives. Some of the major research challenges include fault tolerance.
There have been a number of recent systems that enable streaming processing with the use of high-level APIs.
Table 1. Comparison of big data messaging systems.
|
System |
Characteristics |
Drawbacks |
|
TimeStream [Qian, 2013] |
|
|
|
MillWheel [Akidau, 2013] |
|
|
|
MapReduce Online [Condie, 2010] |
|
|
|
Meteor Shower [Wang, 2012] |
|
|
|
iMR [Lologhetis, 2011] |
|
|
|
Percolator [Peng, 2010] |
|
|
A recent framework Spark has gained a lot of attention due to its different approach and increased performance. Its authors claim in [Zaharia, 2014] that Spark is 20 times faster than Hadoop for iterative applications and can process 1TB in about 5-7 seconds.
The key concept in Spark is represented by RDDs [Zaharia, 2012] (resilient distributed datasets). They consist of a restricted form of shared memory, which is based on coarse-grained operations and transformations (e.g. map, filter, join) to the shared state, as opposed to other systems which process fine-grained updates.
By applying the same operations to many data item sets it is possible to log the transformations and compute the lineage for each RDD, instead of the actual data. An RDD has enough lineage information to compute its partitions from stable storage. RDDs can express cluster programming models such as map-reduce, DryadLINQ, Haloop, Pregel or Sql and allow a more efficient fault tolerance than previous systems but are restricted to applications that perform bulk reads and writes.
D-Stream [Zaharia, 2013] (or Spark Streaming) is an add-on to the Spark engine and is based on the idea of treating streaming computations as series of short interval batch computations. Because it is based on RDDs the process is also deterministic, so lost data can be recomputed without replication and in parallel with the active computations. Consistency is ensured by atomically processing each record within the time interval in which it arrives. Spark streaming inter-operates efficiently with Spark’s batch features. Users can express ad-hoc queries and use the same high level API for processing both historical and streaming data.
One issue with the system is that it does not scale linearly. With many nodes the number of stragglers also increases, which in turn affects the overall performance. Also Spark Streaming supports only the point-to-point pattern compared to other systems, which can operate using broadcast or all-to-one aggregations. There are also other modules and possible improvements that the authors highlight such as enabling asynchrony, version tracking or correctness debugging.
Data cleaning [top]
One of the most common probabilistic models is the Kalman filter, a stochastic and recursive data filtering algorithm which models the value of a sensor as a function of its previous value. Naive Bayes and Markov chains are also proposed in [Elnahrawy, 2003] [Chu, 2005] to identify anomalies. Inferring missing values can also contribute to the quality of processing sensor streams since these values can represent a base for indicating the precision of raw sensor values.
Outliers can be detected using statistical approaches (parametric, non-parametric), nearest neighbour or clustering. A detailed taxonomy of outlier detection methods is presented in [Zhang, 2010].
Declarative cleaning refers to the capability of using SQL-like interfaces with complex background cleaning algorithms. One such interface is proposed in [Mayfield, 2010]. Their aim is to hide the complexity of the cleaning process and expose a friendlier interface to non-experts.
Much of the work on compression and filtering is intended for indexing purposes and less for discovering patterns. Such examples include Fourier transformations [Agrawal, 1993] and approximating functions [Chakrabarti, 2002].
For trend discovery wavelet coefficients are used in [Papadimitriou, 2004]. Other work includes finding representative trends [Indyk, 2000] (a sub-sequence of the time series with the smallest sum of distances from all other equal sub-sequence), motifs [Chiu, 2003] (frequently repeated subsequence), vector quantization, change detection [Ide, 2005] or compressed sensing (a signal processing technique for efficiently acquiring and reconstructing a signal)
Dimensionality reduction can be split into feature selection (find a subset of variables) and feature extraction (transforms data into a high-dimensional space or fewer dimensions). The most well-known technique for dimensionality reduction is the Principal Component Analysis (PCA). PCA converts a set of observations into of possible correlated variables into a set of sorted principal components (uncorrelated variables). The first component has the largest variance.
Processing, storing, and sharing large amount of data [top]
Runtime Environments for Big Data High level languages (i.e., for parallel programming) have been a holy grail for computer science research, but lately researchers made a lot of progress in the area of runtime environments. There is much similarity between parallel and distributed run times, with both supporting messaging with different properties (several such choices are presented in Figure 1, for different hardware and software models). The hardware support of parallelism/concurrency varies from shared memory multicore, closely coupled clusters, and higher-latency (possibly lower bandwidth) distributed systems. The coordination (communication/synchronization) of the different execution units vary from threads (with shared memory on cores), MPI (between cores or nodes of a cluster), workflow or mash-ups linking services together, and the new generation of data intensive programming systems typified by Hadoop (implementing MapReduce) or Dryad.
Figure 1. Combinations of processes/threads and intercommunication mechanisms [Fox, 2010].
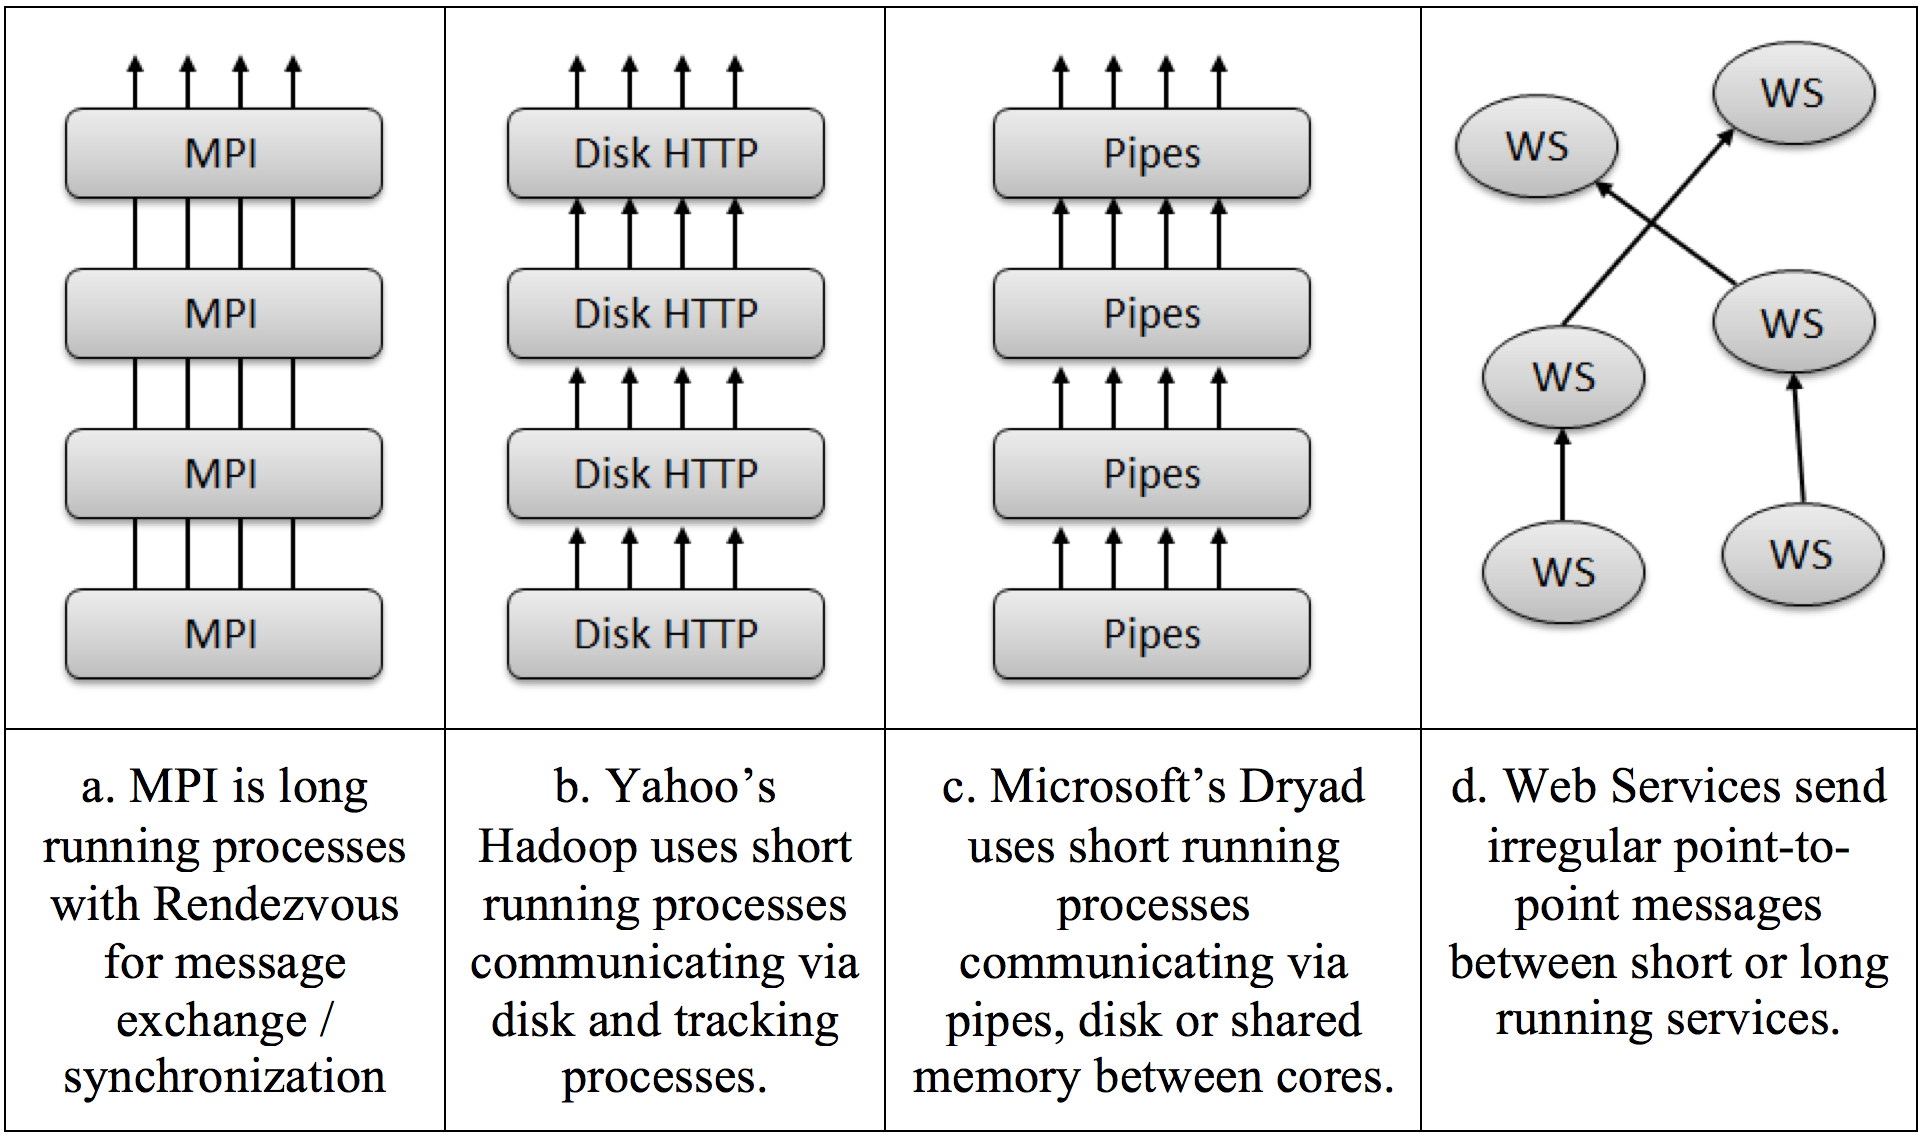
Short running threads can be spawned up in the context of persistent data in memory and have modest overhead [Fox, 2010]. Short running processes (i.e., implemented as stateless services) are seen in Dryad and Hadoop. Also, various runtime platforms implement different patterns of operation. In Iteration-based platforms, the results of one stage are iterated many times. This is typical of most MPI style algorithms. In Pipelining-based platforms, the results of one stage (e.g., Map or Reduce operations) are forwarded to another. This is functional parallelism typical of workflow applications.
An important ambiguity in parallel/distributed programming models/runtimes comes from the fact that today both the parallel MPI style parallelism and the distributed Hadoop/Dryad/Web Service/Workflow models are implemented by messaging. This is motivated by the fact that messaging avoids errors seen in shared memory thread synchronization.
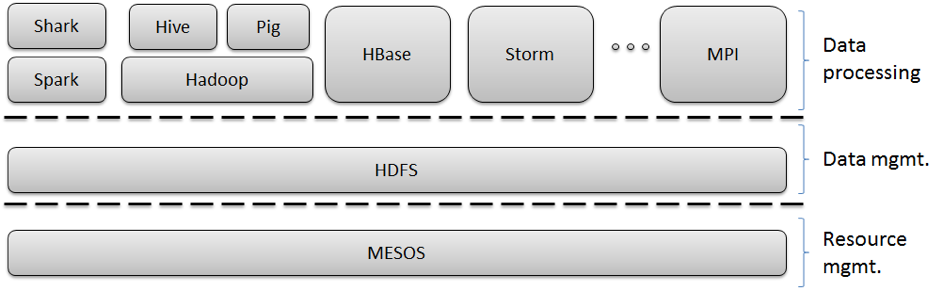
MPI is a perfect example of runtimes crossing different application characteristics. MPI gives excellent performance and ease of programming for MapReduce, as it has elegant support for general reductions. However, it does not have the fault tolerance and flexibility of Hadoop or Dryad. Further MPI is designed for local computing; if the data is stored in a compute node’s memory, that node’s CPU is responsible for computing it. Hadoop and Dryad combine this idea with the notion of taking the computing to the data. A (non-comprehensive) presentation of technologies in use today for Big Data processing is presented in Figure 2.
Figure 2. Example of an ecosystem of Big Data analysis tools and frameworks.
MapReduce programing model [top]
MapReduce (MR) emerged as an important programming model for large-scale data-parallel applications [Dean, 2008]. The MapReduce model popularized by Google is attractive for ad-hoc parallel processing of arbitrary data, and is today seen as an important programming model for large-scale data-parallel applications such as web indexing, data mining and scientific simulations, as it provides a simple model through which users can express relatively sophisticated distributed programs.
MapReduce breaks a computation into small tasks that run in parallel on multiple machines, and scales easily to very large clusters of inexpensive commodity computers. A MR program consists only of two functions, called Map and Reduce, written by a user to process key/value data pairs. The input data set is stored in a collection of partitions in a distributed file system deployed on each node in the cluster. The program is then injected into a distributed processing framework and executed in a manner to be described.
A key benefit of Map Reduce is that it automatically handles failures, hiding the complexity of fault-tolerance from the programmer. If a node crashes, MapReduce automatically reruns its tasks on a different machine. Similarly, if a node is available but is performing poorly, a condition called a straggler, MapReduce runs a speculative copy of its task (also called a ``backup task’’) on another machine to finish the computation faster. Without this mechanism (known as ``speculative execution’’ – not to be confused still with speculative execution at the OS or hardware level for branch prediction), a job would be as slow as the misbehaving task. In fact, Google has noted that in their implementation speculative execution can improve job response times by 44% [Dean, 2008].
Google's MapReduce implementation is coupled with a distributed file system named Google File System (GFS) [Ghemawat, 2012] from where it reads the data for MapReduce computations, and in the end stores the results. According to J. Dean et al., in their MapReduce implementation [Dean, 2008], the intermediate data are first written to the local files and then accessed by the reduce tasks.
The popular open-source implementation of MapReduce, Hadoop [Zaharia, 2008], is developed primarily by Yahoo, where it runs jobs that produce hundreds of terabytes of data. Today Hadoop is used at Facebook, Amazon, etc. Researchers are using Hadoop for short tasks where low response time is critical: seismic simulations, natural language processing, mining web data, and many others. Hadoop includes several specific components, such as its own file system, HDFS. In HDFS, data is spread across the cluster (keeping multiple copies of it in case of hardware failures). The code is deployed in Hadoop to the machine that contains the data upon which it intends to operate on. HDFS organizes data by keys and values; each piece of data has a unique key and a value associated with that key. Relationships between keys can be defined only within the MapReduce application.
Other solutions related to MapReduce [top]
Later on, mostly to alleviate the burden of having to re-implement repetitive tasks, the MapReduce community is migrating high-level languages on top of the current interface to move such functionality into the run time. Pig [Olston and Hive [Thusoo, 2010] are two notable projects in this direction. Such domain-specific languages, developed on top of the MapReduce model to hide some of the complexity from the programmer, today offer a limited hybridization of declarative and imperative programs and generalize SQL’s stored-procedure model. Some whole-query optimizations are automatically applied by these systems across MapReduce computation boundaries. However, these approaches adopt simple custom type systems and prove limited support for iterative computations.
An alternative tool on top of Hadoop is being developed by Facebook. Hive lets analysts crunch data atop Hadoop using something very similar to the structured query language (SQL) that has been widely used since the 80s. It is based on concepts such as tables, columns and partitions, providing a high-level query tool for accessing data from their existing Hadoop warehouses [Thusoo, 2010]. The result is a data warehouse layer built on top of Hadoop that allows for querying and managing structured data using a familiar SQL-like query language, HiveQL, and optional custom MapReduce scripts that may be plugged into queries. Hive converts HiveQL transformations to a series of MapReduce jobs and HDFS operations and applies several optimizations during the compilation process.
The Hive data model is organized into tables, partitions and buckets. The tables are similar to RDBMS tables and each corresponds to an HDFS directory. Each table can be divided into partitions that correspond to sub-directories within an HDFS table directory and each partition can be further divided into buckets, which are stored as files within the HDFS directories.
It is important to note that Hive was designed for scalability, extensibility, and batch job handling, not for low latency performance or real-time queries. Hive query response times for even the smallest jobs can be of the order of several minutes and for larger jobs, may be on the order of several hours. Also, today Hive is the Facebook’s primary tool for analyzing the performance of online ads, among other things.
Pig, on the other hand, is a high-level data-flow language (Pig Latin) and execution framework whose compiler produces sequences of Map/Reduce programs for execution within Hadoop [Olston, 2008]. Pig is designed for batch processing of data. It offers SQL-style high-level data manipulation constructs, which can be assembled in an explicit dataflow and interleaved with custom Map- and Reduce-style functions or executables. Pig programs are compiled into sequences of Map-Reduce jobs, and executed in the Hadoop Map-Reduce environment.
Pig’s infrastructure layer consists of a compiler that turns (relatively short) Pig Latin programs into sequences of MapReduce programs. Pig is a Java client-side application, and users install locally – nothing is altered on the Hadoop cluster itself. Grunt is the Pig interactive shell. With the support of this infrastructure, among the important advantages of Pig we mention the optimized data reading performance, the semi-structured data, and modular design. However, several limitations should not be ignored, such as the large amount of boiler-plate Java code (although proportionally less than Hadoop), the effort for learning how to use Pig and the lack of debugging techniques.
Spark is a framework that supports such applications while retaining the scalability and fault tolerance of MapReduce [Zaharia, 2010]. Spark provides two main abstractions for parallel programming: resilient distributed datasets and parallel operations on these datasets (invoked by passing a function to apply on a dataset).
Resilient distributed datasets (RDDs) are read-only collections of objects partitioned across a set of machines that can be rebuilt if a partition is lost. Users can explicitly cache an RDD in memory across machines and reuse it in multiple MapReduce-like parallel operations {zaharia2012resilient}. RDDs achieve fault tolerance through a notion of lineage: if a partition of an RDD is lost, the RDD has enough information about how it was derived from other RDDs to be able to rebuild just that partition.
Spark is implemented in Scala, a statically typed high-level programming language for the Java VM, and exposes a functional programming interface similar to DryadLINQ. Spark can also be used interactively, and allows the user to define RDDs, functions, variables and classes and use them in parallel operations on a cluster. According to experiments [Zaharia, 2010], by making use extensively of memory storage (using the RDD abstractions) of cluster nodes, most of the operations Spark can outperform Hadoop by a factor of ten in iterative machine learning jobs, and can be used to interactively query a large dataset with sub-second response time.
Twister is another MapReduce extension, designed to support iterative MapReduce computations efficiently [Ekanayake. Twister uses a publish/subscribe messaging infrastructure for communication and data transfers, and supports long running map/reduce tasks, which can be used in “configure once and use many times” approach. In addition, it provides programming extensions to MapReduce with “broadcast” and “scatter” type data transfers. It also allows long-lived map tasks to keep static data in memory between jobs in a manner of “configure once, and run many times”. Such improvements allow Twister to support iterative MapReduce computations highly efficiently compared to other MapReduce runtimes.
Dryad is a general-purpose distributed execution engine for coarse-grain data-parallel applications [Isard, 2007]. While MapReduce was designed to be accessible to the widest possible class of developers (aiming for simplicity at the expense of generality and performance), the Dryad system allows the developer fine control over the communication graph as well as the subroutines that live at its vertices. A Dryad application developer can specify an arbitrary directed acyclic graph to describe the application’s communication patterns, and express the data transport mechanisms (files, TCP pipes, and shared-memory FIFOs) between the computation vertices.
Dryad runs the application by executing the vertices of this graph on a set of available computers, communicating as appropriate through files, TCP pipes, and shared-memory FIFOs. The vertices provided by the application developer are quite simple and are usually written as sequential programs with no thread creation or locking. Concurrency arises from Dryad scheduling vertices to run simultaneously on multiple computers, or on multiple CPU cores within a computer. The application can discover the size and placement of data at run time, and modify the graph as the computation progresses to make efficient use of the available resources.
Dryad is designed to scale from powerful multi-core single computers, through small clusters of computers, to data centers with thousands of computers. The Dryad execution engine handles all the difficult problems of creating a large distributed, concurrent application: scheduling the use of computers and their CPUs, recovering from communication or computer failures, and transporting data between vertices.
DryadLINQ is a system and a set of language extensions that enable a programming model for large scale distributed computing [Yu, 2008]. It generalizes execution environments such as SQL, MapReduce, and Dryad in two ways: by adopting an expressive data model of strongly typed .NET objects; and by supporting general-purpose imperative and declarative operations on datasets within a traditional high-level programming language. A DryadLINQ application is a sequential program (hence, the programmer is given the “illusion” of writing for a single computer), composed of LINQ (Language Integrated Query) expressions performing imperative or declarative operations and transformations on datasets, and can be written and debugged using standard .NET development tools. Objects in DryadLINQ datasets can be of any .NET type, making it easy to compute with data such as image patches, vectors, and matrices. DryadLINQ programs can use traditional structuring constructs such as functions, modules, and libraries, and express iteration using standard loops. Crucially, the distributed execution layer employs a fully functional, declarative description of the data-parallel component of the computation, which enables sophisticated rewritings and optimizations like those traditionally employed by parallel databases. The DryadLINQ system automatically and transparently translates the data-parallel portions of the program into a distributed execution plan, which is passed to the Dryad execution platform, which further ensures efficient, reliable execution of this plan.
Sharing the data [top]
Sharing the data is another challenge for Big Data applications, besides processing. With all the BigData tools and instruments available, we are still far from understanding all the complexities behind processing large amounts of data. Recent projects such as BigQuery have the potential to encourage scientists to put their data into the Cloud, where potentially others might have access as well. BigQuery is a tool developed by Google to allow ordinary users run ad hoc queries using an SQL-like syntax. Google had used previously the tool (under the name Dremel) internally for years before releasing a form of it in their generally available service - BigQuery - capable to get results in seconds from terabytes of data [Vrbic, 2012]. The tool is hosted on Google's infrastructure. Its main advantage is simplicity: compared to Hadoop, which requires set up and administration, companies can take their data, put it in Google's cloud, and use it directly into their applications.
Similarly, Facebook is building Prism [Roush, 2013], a platform currently rolling out across the Facebook infrastructure. The typical Hadoop cluster is governed by a single “namespace” and a list of computing resources available for each job. In opposition, Prism carves out multiple namespaces, creating many “logical clusters” that operate atop the same physical cluster. Such names spaces can then be divided across various Facebook teams, and all of them would still have access to a common dataset that can span multiple data centers.
Nexus is a low-level substrate that provides isolation and efficient resource sharing across frameworks running on the same cluster, while giving each framework freedom to implement its own programming model and fully control the execution of its jobs [Hindman, 2009]. As new programming models and new frameworks emerge, they will need to share computing resources and data sets. For example, a company using Hadoop should not have to build a second cluster and copy data into it to run a Dryad job. Sharing resources between frameworks is difficult today because frameworks perform both job execution management and resource management. For example, Hadoop acts like a “cluster OS” that allocates resources among users in addition to running jobs. To enable diverse frameworks to coexist, Nexus decouples job execution management from resource management by providing a simple resource management layer over which frameworks like Hadoop and Dryad can run.
Mesos is a thin resource sharing layer that enables fine-grained sharing across diverse cluster computing frameworks, by giving frameworks such as Hadoop or Dryad a common interface for accessing cluster resources [Hindman. To support a scalable and efficient sharing system for a wide array of processing frameworks, Mesos delegates control over scheduling to the framework themselves. This is accomplished through an abstraction called a “resource offer”, which encapsulates a bundle of resources that a framework can allocate on a cluster node to run tasks. Mesos decides how many resources to offer each framework, based on an organizational policy such as fair sharing, while frameworks decide which resources to accept and which tasks to run on them. While this decentralized scheduling model may not always lead to globally optimal scheduling, in practice its developers found that it performs surprisingly well in practice, allowing frameworks to meet goals such as data locality nearly perfectly [Hindman, 2011]. In addition, resource offers are simple and efficient to implement, allowing Mesos to be highly scalable and robust to failures.
3 Water Models
Water is an important resource in many of the human activities. Thus, water management should include an integrated view of several distinct systems from different domains: environment, agriculture, industry, etc. As a result, there are many complex interactions between different factors, some of them not immediately apparent. In this context there is an imminent need for complex modelling solutions for water-based systems.
A model is a simplified, schematic representation of the real world. Models are meant to help engineers, scientists and decision–makers to determine what is happening in reality and to predict what may happen in the future. In particular, they are useful for the assessment of the impact of human activities on the environment or on artificial systems.
A classical definition of the model is “a simplification of reality over some time period or spatial extent, intended to promote understanding of the real system” [Bellinger, 2006] or “A model is a simplification of reality that retains enough aspects of the original system to make if useful to the modeller” [Eykhoff, 1974]. In this context the system is defined to be a part of reality (isolated from the rest), which consists of entities that are in mutual relationships (processes) and have limited interactions with the reality outside of the system.
A model is a physical or mathematical description of a physical system including the interaction with the outside surrounding environment, which can be used to simulate the effect of changes in the system itself or the effect of changes due to conditions imposed on the system.
The selection of the appropriate model together with the associated parameters is an important element in modelling water related problems. [K.W. Chau, 2007]
Nowadays modelling solutions are used intensively in hydroinformatics. There are two main paradigms in modelling aquatic environment physically-based modelling and data-driven modelling [Donald K., 2005].
Physically based distributed modelling, uses a description of the physical phenomenon which govern the behaviour of water in the system under study. The principles that are applied are mass conservation and additional laws describing the driving forces.
Results of modelling depends on the level of knowledge being encapsulated within the software package.
Physically based models (see Section 3.1) are considered to be deterministic when they provide a unique output to a given input. The main advantage of such approach is that it can be applied to a wide range of input data after the initial testing and calibration of the model has been carried out. One of the disadvantages of this approach is that they can generate a large amount of information, since they require small steps of computation both in space and time.
Different solutions of modelling software tools (see Section 3.1, Available software tools) led to improvements in the understanding of large-scale water-based systems, such as rivers or coastal waters. Many of these solutions have been extended to include external influence factors such as advection and dispersion of pollutants in the flow, the transport of sediment in suspension or other similar examples.
The second modelling approach is data-driven for which the main principle is to connects one set of output data with the corresponding input set. Such a model can only work if enough observed (measured data) are available. The model is based on finding different correlations between data sets in order to determine the best input-output pair.
There are several data-driven modelling techniques, such as (see Section 3.2): Neural Networks, Nearest neighbour model, Genetic algorithms model, Fuzzy rule based system model, Decision/model tree model, and Support vector machine model.
3.1 Physically-based modelling
As briefly mentioned in the introduction, physically-based models are those that solve differential equations that represent different physical processes of water motion by numerical approximation in space and/or time. Examples of processes where such approaches are applied are: water quantity and quality, flood routing, rainfall-runoff and groundwater flow.
A common distinction between different kinds of physically based models is with respect to the number of spatial dimensions used for the mathematical representation of the modelled physical processes. Therefore models are: zero-dimensional (or lumped conceptual) where all spatial dimensions are ignored and only temporal variations are considered (treating water system elements as lumped units, without spatial representation); one-dimensional models (1-D) used for example in river systems modelling, where the river is considered as a 1-D spatial element; two-dimensional (2-D, used in flood analysis, or analysis of groundwater systems; and three –dimensional ones (3-D), used for detailed analysis of lake systems, or three-dimensional flow around hydraulic structures.
These different modelling approaches are commonly associated with certain application areas. Hydrological models, for example, frequently use 0-D and simplified versions of 1-D approaches. Similarly, water allocation models (also mainly use 0-D. Models of urban water systems, such as water distribution and drainage networks are commonly using 1-D approaches, while hydraulic models of rivers and floodplains are combining 1-D and 2-D approaches. Detailed analysis of deep lakes is carried out with 3-D models. Water quality modelling can be associated with any of these models, however, the complexity representation of the water quality parameters and their interactions is different for 0-D,1-D, 2-D or 3-D models.
Mathematical representation of the physical processes also depends on the type of flow that is being considered, such as pressurized free surface or groundwater flow.
Nowadays there are many physically based modelling systems available. These are software packages that incorporate generic algorithms for solving particular mathematical equations, applicable for a given application domain. By introducing data for a specific case, such as boundary conditions, parameters, geometry, etc. the modelling system can be used to instantiate a model for a particular situation (i.e. river, catchment, aquifer system, ) depending on the application. The availability of modelling systems has introduced different business models in relation to delivery of water modelling software products and services, which are continuously evolving. Current business model trends are towards deploying instantiated models and even modelling tools on the Internet, which will increase their accessibility and usage for different water management tasks.
Examples of well-known European modelling systems are: MIKE ZERO modelling suite developed by Danish Hydraulic Institute (DHI) from Denmark s; Delft3D and Sobek released by Deltares, from the Netherlands; and Infoworks of Wallingford Software from UK. Elsewhere, like in USAmany modelling systems are developed and maintained by different federal agencies, such as United States Geological Survey ( USGS); US Army Corps of Engineers (USACE), Environmental Protection Agency (EPA), etc.
Frequently newly released modelling systems are freely available, and some do lack sophisticated user interfaces for pre- and post-processing of data and modelling results. Different private companies develop such components around the freely available modelling systems and offer them as commercial products and services (e.g. Bentley, Aquaveo). In addition, many academic centres, such as universities and research institutes maintain freely available academic software, which sometimes develops into larger open source projects for water modelling software.
The primary advantage of physically-based models is that they contain representations of the physical system and can be used for modelling change that may be introduced in such systems. Therefore, they are indispensable support for design and planning tasks. Their disadvantages may be large data requirements for being set up and sometimes long computational times.
Hence sophisticated physically-based models may not be needed for regular operational management tasks. Another category of water models, named ‘data-driven models’ has recently emerged as an alternative to-, and often complementary use with physically based models.
Available software tools
Among the tools to support hydrological modelling and decision-making, Geographical Information System (GIS) is highly regarded as an important instrument for data management. For example, even when surface water and groundwater are modelled separately, GIS can support integration between them [Facchi, 2004]. For example, modelling software like Mike BASIN is selected often by different authors to model surface water. Groundwater models are also available are available in the ASM software. When both surface water and groundwater need to be modelled together, both for quantity and quality evaluations, such tools (actually, the complexity comes from the integration of the models these two provide) can be by means of a GIS, to support efficient data management. Such an approach was demonstrated in [Jain, 2004], where authors developed a process oriented distributed rainfall runoff model, which used a GIS to generate model inputs in terms of land use, slope, soil and rainfall. This allowed the model to handle catchment heterogeneity.
Similarly, the GIS software ArcView, developed by ESRI, combines several capabilities for mapping systems along with the ability to analyse geographic locations and the information linked to those locations. A powerful feature of ArcView GIS is the ability to carry out mathematical and logical operations on spatial data. Furthermore, tabular data from Arcview dBASE files can be created or manipulated using Microsoft Excel, which is useful in facilitating the integration of ArcView with other software.
But the power of such modelling tools can really be put to use when combined. As a pioneer case study, authors in [Ireson] proposed a methodology for loosely-coupling the MIKE BASIN with the ASM provided water models, and demonstrate a series of what-if scenarios for the effect of dams on the groundwater.
MIKE
MIKE BASIN, developed by DHI software, is an extension of ArcView, which uses GIS information as a basis of a water resources evaluation. Crucially, MIKE BASIN adds to ArcView the capability to deal with temporal data, in addition to the spatial data stored in the GIS. MIKE BASIN is a water resources management tool, which is based on the basin-wide representation of water availability. Rivers and their main tributaries are represented mathematically by a network of branches and nodes. Nodes are point locations, where it is assumed that water enters or leaves the network through extractions, return flow and runoff. These may be confluences, diversions, locations where certain water activities occur (such as water offtake points for irrigation or a water supply), or important locations where model results are required. Rainfall-runoff modelling can be carried out in MIKE BASIN using the NAM model, a lumped, conceptual rainfall-runoff model suitable for modelling rain-fall-run-off processes on the catchment scale. This can be used to simulate overland water flows, for example.
ASM
ASM, Aquifer Simulation Model for Microsoft Windows, is a complete two-dimensional groundwater flow and transport model. ASM include the instruments to model either confined and unconfined aquifers. For modelling an aquifer as a confined aquifer, the governing equations are based on transmissivity parameters, which are fixed because the saturated depth is fixed (in reality, when the water level in the aquifer drops below the confining layer, the saturated depth of the aquifer decreases, as does the transmissivity; thus, strictly speaking, the model is fundamentally flawed in this manner). For a steady-state model, the groundwater levels do not change once the solution has converged. Therefore, in such a model the transmissivity is effectively fixed, meaning the basic assumptions are still valid, however the data used to define the model should be based on measured or calibrated transmissivity and not on measured hydraulic conductivity. This also means that only steady-state analysis can be carried out with this model.
3.2 Data Driven models
The second type of modelling, data-driven, even if it has a similar purpose of connecting one set of output data with the corresponding input set, it is very different in functionality than the physically-based one. It works only with data in the ‘boundaries’ of the domain where data is given. Also, it generates less to none information outside the scope of the model. The model is based on finding different correlations between data sets in order to determine the best input-output pair.
There are several data-driven modelling methods. The most popular of them are presented in the following sub-sections.
Artificial Neural Network (ANN) model
This is one of the most popular data-driven modelling solutions. This paradigm is inspired by the way in which the human brain process information. The model gathers knowledge by detecting relations between data sets and different patterns. An ANN model consists of many artificial neurons or processing units that are connected, forming a complex neural structure. Each processing unit has input sets, a transfer function and one output. The connections between the processing units have a corresponding coefficient or weight. These weights are used as the adjustable parameters of the system. The transfer function determines the behaviour of the network along with the learning rules, and the architecture itself.
A common neural network model used in many hydroinformatics modelling applications is the Multi-Layer Perceptron (MLP). The MLP network has three different types of layers: input, hidden and output. Figure 3 depicts a single layer fully connected MLP.
Figure 3. Structure of Artificial Neural Network model [Stanford, 2016].
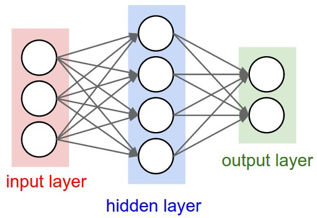
The neural networks are capable of representing any system, even the ones that imply complex, arbitrary and non-linear processes that correlate the input with to output. They are ideal in modelling complex hydrological phenomenon. Paper [Tanty, 2015] presents an analysis of the applications in hydroinformatics modelling that use the MLP model. They divided these applications into four categories: Rainfall-runoff, Stream-Flow, Water Quality and Ground-Water modelling.
Rainfall-runoff Modelling. The first category contains solutions in rainfall-runoff modelling. The modelling applications from this category focused on building virtual hydrological systems, or on predicting monthly rainfall-runoff. The modelling techniques have improved over the years. Thus, in paper [Rajurkar, 2002] the ANN model is combined with multiple-input-single-output (MISO) model in order to have a more accurate representation of the rainfall-runoff relationship for large size catchments. In [Goyal, 2010] is presented an ANN model that uses dimensionless variables. The model analyses the mean monthly rainfall runoff data from several Indian catchments. The results show that this type of modelling is better that the classic ANN model in representing the rainfall-runoff process. In paper [Chen, 2013] the authors presented an ANN model for rainfall-runoff in the context of a typhoon. Other two techniques were used for an accurate interpretation of the results: Feed Forward Backpropagation [Blass, 1992] and Conventional Regression Analysis [Berk, 2004].
Stream-Flow Modelling. Streamflow forecasting is a key element of water systems. It is important especially in the case of critical water resources’ operations for important areas like economy, technology etc. Also, by using this type of forecasting, real-time operations of a specific water resource system can be analysed. There are several articles that present solutions for stream-flow modelling. In papers [Shrivastava, 1999] [Chattopadhyay, 2010] ANN in compared with the Autoregressive Integrated Moving Average (ARIMA) model. In both papers the authors have concluded that ANN produces better results than ARIMA. In papers [Markus, 1995] [Abudu, 2010] the authors present a hybrid modelling solution using ANN with transfer-function noise (TFN) models. The input used were data regarding snow telemetry precipitation and snow water equivalent from the Rio Grande Basin station in Southern Colorado. Their hybrid approach has improved significantly the one-month-ahead forecast accuracy, if compared with simple TFN or ANN models. Also, it has a better generalisation capability than the simple solutions. Another hybrid solution in presented in [Wang (2006)]. The proposed forecasting of daily streamflow model is using three types of hybrid ANN: Threshold-based ANN (TANN), the Cluster-based ANN (CANN), and the Periodic ANN (PANN).
Water Quality Modelling. Lately, the ANN model was used in water quality modelling. Neural Networks are most suited for this type of modelling, as water quality is characterised by a large group of chemical, biological and physical parameters, with complex interactions between them. Paper [Mayer, 1996] demonstrates the efficiency of ANN for this type of complex modelling. The proposed solution was used to estimate the salinity in the River Murray in South Australia. For their solution, the authors designed an ANN model with two hidden layers, and for the training they used a back-propagation function. The input of the model was composed of the following: the daily salinity values, the water levels and flow at upstream stations and at antecedent times. After analysing their results, the authors concluded that their solution could reproduce salinity levels, with the good accuracy, based only on 14 day forecasts. Paper [Zaheer, 2003] presents a decision-making ANN solution for water quality management. This decision making system interprets the input data based on a set of rules. The main objective is to control the environmental pollution. In [Diamantopoulos, 2007] the authors used a Cascade Correlation Artificial Neural Network (CCANN) to determine with accuracy the missing monthly values of water quality parameters mainly in rivers. As case studies, they used input from two rivers near Greek borders: Axios and Strymon River, on which they did a detailed analyse of water quality for a period over 10 years. It has been demonstrated that hybrid modelling solutions can bring improvements in water forecasting. As an example, in the paper [Huiqun, 2008] such a hybrid solution is presented. The authors analyse the of Dongchang lake in Liaocheng city using a combination between ANN and Fuzzy logic.
Ground-Water Modelling. Water quality and ground water modelling are closely related. Ground water is important as a supply resource in different critical areas, such as farming, industrial-based or municipal-based activities. Groundwater level forecasting must be very accurate, as the water level changes periodically. An important analysis regarding the forecasting precision of the ANN models in ground water management is presented in paper [Nayak, 2006]. The model choses the input set that influences most the prediction by using a combination of statistical analysis and domain knowledge. According to the results from this paper, an ANN model is able to forecast the ground water level up to 4 months in advanced with an acceptable precision.
Nearest neighbor model
This model is used mostly in classifications and regressions. It starts from the assumption that nearby points are more likely to be given the same type or same classification that distant ones. An implementation of this model is presented in paper [Buishand, 2001]. The paper presents a multisite generation model of daily precipitation and temperature in a large area using nearest-neighbour resampling. The proposed model efficiency is tested through a set of scenarios such as simulation of extreme precipitation and snowmelt.
Genetic algorithms model
Genetic algorithms (GA) are a subclass of evolutionary algorithms and are based on the Darwinian principles of evolution and natural selection. A genetic algorithm searches for a solution to a problem by evolving a population of individuals towards fitness maximization.
The essential aspects of any genetic algorithm are: representing a solution to the problem as an individual (encoding), evaluating how good an individual is (fitness), and evolving better individuals from the existing ones (selection, crossover). One important advantage of the GA modelling is the possibility of designing simple hydrological models. This is an important feature, as most of the data driven modelling solutions are too complex, thus the user cannot easily determine what is happening during the model computation. Several solutions have been proposed for GA water modelling (e.g. [Ghorbani, 2010], [Sreekanth, 2012])
Fuzzy rule based system model
Systems based on Fuzzy logic can work with highly variable, vague and uncertain data and are frequently used in decision-making as they provide a logical and transparent stream processing from data collection down to data usage. And thus they are ideal in modelling the complex hydrological events.
In the artificial neural network section, we presented different type of hydrological models, such as rainfall–runoff modelling applications. This type of applications has a non-linear behaviour and is affected by a large variety of external factors. For example, for the rainfall–runoff modelling we have factors such as rainfall characteristics, soil moisture, watershed morphology and so on. And, although the ANN provides accurate results, it has a black box approach. Lately, the research has focus on this black box characteristic by designing semantic-based fuzzy neural architecture, a combination between ANN and fuzzy logic. Such a solution is presented in paper [Talei, 2010]. The authors present a detailed analyse of Adaptive Network-based Fuzzy Inference Systems (ANFIS) in rainfall–runoff modelling. They have implemented and tested15 different ANFIS models.
Decision/model tree model
In this model the instances are classified by sorting them up the “tree” from the “root” to some “leaf” node that provides a classification of the instance. Each node tree specifies a test of some attribute of the instance, and each branch descending from a node corresponds to one of the possible values for this attribute. An instance is classified by starting at the root node of the tree, testing the attribute specified by this node, the moving down the branch corresponding to the value of the attribute. This process is repeated for the sub-tree root based at the new node.
Support vector machine model
SVM is a learning system and it is based on statistical learning theory [Vapnik, 1998]. A specific characteristic of SVM is that its structure is not determined a priori. It uses an approximation function (kernel function) that is chosen based on how well it fits the verification and the training set using statistical learning theory. A comparison between ANN and SVM is done in paper [Yoon, 2011].
Figure 4. Schematic diagram for (a) ANN and (b) SVM [Yoon, 2011].
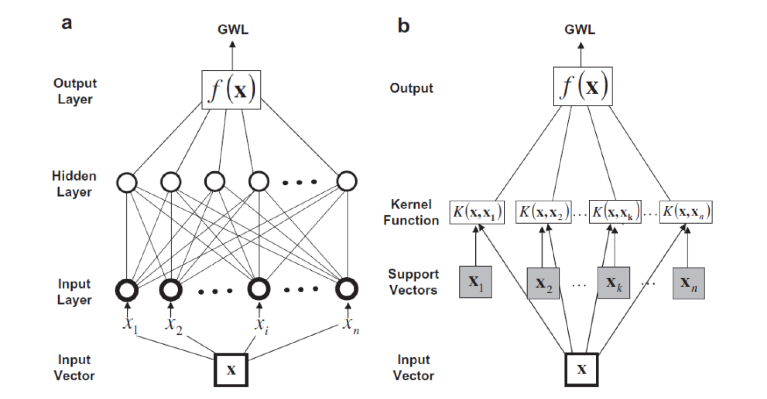
4 ICT based systems for monitoring, control and decision support
For water management, models used to be derived by scientists without the involvement of policy makers – they were mostly derived purely from analysis and observation of the natural world, thereby contributing an objective opinion to decisions without accounting for the values, knowledge or priorities of the human system that affects and is affected by the system being modelled. As a result, models were frequently being rejected, especially when the scientific findings demonstrated a need for unpopular decisions related to human behaviour. The shift towards more open and integrated planning processes is one way to avoid potential misunderstandings (and even litigation), and has required the adaptation of the scientific modelling process to incorporate community knowledge, perspective and values. Such open and integrated planning processes include participatory modelling and Integrated Water Resource Management (IWRM) [Voinov, 2008] (see Section 4.1).
Monitoring the stream discharge is considered to be of vital importance for the management of water resources, and developed in time from on-site measurements to complex, ICT based systems. While the measurement protocols for steady flows are well established and allow continuous monitoring, during unsteady flows the measurement protocols for monitoring systems are still under development and evaluation (see Section 4.2).
Monitoring environments require ubiquitous sensing nodes that can be conveniently deployed and operate for extended periods of time (several years) while requiring minimal or no maintenance effort [Puccinelli, 2005]. While a broad spectrum of environmental sensor modalities has been utilized and evaluated for data management and control, implementations of mobile application that use Cloud Computing paradigm in a standard framework that fulfill these requirements are rare. Monitoring and data processing for developing sound solutions for a sustainable management of water ecosystems became more flexible, exiting and accurate with the widespread of information and communication technology solutions in this domain. Application of ICT in varied areas led to a rapid development of advanced information systems for e-services, creating what is known as an information society (see Section 4.3).
Environmental data is often observed and shared by multiple devices and organizations (geo-graphically distributed). Moreover, some applications may require data processing across sites. Recently, Hadoop emerged as the de facto state-of-the-art for data analytics. Hadoop is optimized to co-locate data and computation and therefore mitigate the network bottleneck when moving data [Hadoop, 2014]. However, as data may not be equally distributed across sites and since intermediate data are required to be aggregated to produce final results, Hadoop may suffer severe performance degradation in such distributed settings. Thus, in our research activities we intend to address Hadoop limitations and therefore to explore new data distribution techniques and scheduling policies that can co-operatively deal with distributed big data processing for single and multiple concurrent applications (see Section 4.4).
The access to data and processing services from any device is important for different categories of users. Mobile cloud computing is a new paradigm that evolves from cloud computing and adapts the access to services to advanced ICT technologies (see Section 4.5).
A new approach is base on IoT systems. The IoT trends and relation to water resources management is presented in Section 4.6, considering several hardware and software technologies.
Failure and network partitions are common in large-scale distributed systems. The solutions elaborated for large scale distributed systems consider that failures are a norm, not an exception. The common approach is based on data replication, having as result the avoidance of single points of failure (see Section 4.7).
In contrast with the traditional one-sectorial approach to water management, the integrated approaches recognize the fundamental linkages between water uses (e.g., agriculture, water supply, navigation, hydropower, environment, recreation) and their impact on the watershed resources viewed as a system [Pangare, 2006]. The most widely used frameworks for integrative and adaptive management are IWRM and AM. In essence, IWRM (see Section 4.8, Integrated Water Resources Management (IWRM)) is a participatory planning and implementation process, based on sound scientific, which brings together stakeholders to determine how to meet society’s long-term needs for water resources while maintaining essential ecological services and economic benefits. In addition of these fundamental features, the Global Water Partnership (GWP) focuses on the importance of the IWRM in addressing the issues of poverty reduction and sustainable development in the context of the less-developed countries. AM (see Section 4.8, Adaptive Management (AM)), as a concept, has been designed primarily to support managers in dealing with uncertainties inherent in complex ecological system required to meet multiple objectives. AM combines multidisciplinary scientific research, policy development, and local practice in a cyclic learning process aimed at leading to more effective decision making and enhanced environmental, social, and economic benefits [Williams, 2007].
The chapter end with several approaches of water resources management based on Information-centric systems (ICS) for watershed investigation and management (see Section 4.9), supervisory control and data acquisition systems (see Section 4.10) and decision-support systems for water community-driven efforts considering an use case on IoWaDSS Technological Framework (see Section 4.11).
4.1 Integrated Water Resource Management
In Integrated Water Resource Management (IWRM), water-related planners and decision makers make use of a range of tools, techniques and models tailored for the integration of all stakeholders into any water-related decision process. In water management, researchers and practitioners tend to agree that each case use best a particular type of tool or different model - it is simply up to the planner to select the best approach. In this sense, the Global Water Partnership, one of the largest forums crated around the IWRM concept, created a set of policies and approaches they recommend to practitioners interested in the implementation of IWRM. Their recommendations include legal, financial and institutional actions and reforms that need to be done at the regional and national levels to provide the overarching framework within which IWRM can be successfully implemented. In addition, it includes references to a set of Management Instruments, which are the proposed techniques to control water supply and demand. For these techniques, many models have been designed to facilitate integration between various aspects of catchment hydrology, including surface water, groundwater, vegetation, ecology, and even agricultural economics. Examples include NELUP [O'Callaghan, 1995], MIKE SHE [Refsgaard, 1995], and TOPOG [Vertessy, 1994]. Such types of model are excellent for water resource assessments and impact on the environment, but in most cases they do not link directly to the wider social, cultural and economic aspects of water management. Which is why researchers have proposed decision support systems (DSSs), as complementary tools to models. A DSS is a means of collecting data from many sources to inform a decision. Information can include experimental or survey data, output from models or, where data is scarce, and expert knowledge. Authors in [Cai, 2001] identify a number of the more widely used types of DSS and list some of the associated commercial packages; the types include influence diagrams, decision trees, mathematical models, multi-criteria analysis and spreadsheets.
Such DSS tools and models were proposed in various studies about water monitoring/management [De Zwart, 1995], and as mentioned before, are usually specifically tailored for one particular problem, to sustain the case being presented in each work. For example, diffuse of pollution from nutrients, namely nitrogen and phosphorus was presented in a vast study in [Munafo, 2005]. As the article specifies, the number of chemicals released into surface water bodies is extremely large; their dynamics are complex and it is difficult to measure the global impact. The European inventory of existing chemical substance (EINECS) identified more than 100,000 chemicals, but there is not satisfactory knowledge of their routes of entry into surface waters yet. Furthermore, EINECS is likely to have underestimated the number of pollutants, for it does not take into account all by-products deriving from physical, chemical and biological degradation. The management of non-point pollution of rivers and its prevention are priority factors in water monitoring and restoration programmes.
The scientific community proposed many models for depicting the dynamics of pollutants coming from diffuse sources. In fact, most of them can be grouped into two broad categories: statistical models and physically based models. A major drawback of statistical or physically based models for non-point pollution is the large amount of data required both as input and for calibration and validation of the model. Other possible problems are long computing time, complexity related to the development of appropriate models, and the highly skilled operators required for using them. More recently, PNPI was proposed as s a GIS-based, watershed-scale tool designed using multi-criteria technique to pollutant dynamics and water quality [Munafo, 2005]. The method for calculating PNPI follows an approach quite similar to the environmental impact assessment. The pressure exerted on water bodies by diffuse pollution coming from land units is expressed as a function of three indicators: land use, run-off and distance from the river network. They are calculated from land use data, geological maps and a digital elevation model (DEM). The weights given to different land uses and to the three indicators were set according to experts’ evaluations and allow calculation of the value of the PNPI for each node of a grid representing the watershed; the higher the PNPI of the cell, the greater the potential impact on the river network.
4.2 Event-based monitoring of in stream processes
The main protocols for continuous discharge estimation are stage-discharge, index-velocity, and slope-area methods. The continuous monitoring methods are based on semi-empirical relationships built around elementary hydraulics formulae and simplifying assumptions that cannot encompass all the flow complexities. Most monitoring systems are based on the assumption of a steady and uniform regime for the channel flow.
For unsteady flows the relation-ships between variables are more complicated as the relationships between variables are not unique being distinct for the rising and falling stages of a time-varying event (e.g., [Schmidt, 2002]; [Nihei, 2006]; [Perumal, 1999]).
Frequently, estimation of stream discharges is based on the stage-discharge rating method ([Rantz, 1982]). Advances in acoustic and other sensing technologies, allowed the development of new methods and the continuous improvement of the existing ones. This is the case with the index-velocity and the continuous slope-area methods that are driven by various technologic advancements after the 1980’s ([Levesque, 2012]; [Smith, 2010]).
The main methods are shortly described in the following.
The Stage-discharge method (HQRC) is based on unique stage-discharge empirical relationships relating stage to discharge. Shifting and loops in the steady rating curves (RCs) may result from a number of physical factors such as in-channel modifications, presence and growth of vegetation, unsteady flow due to flood wave propagation, backwater, etc. Therefore, there is a need for adjusting HQRCs whenever deviations are observed during operations.
In addition to continuously measure the stage, the Index-velocity method (IVRC) method requires measurement of the stream velocity over a portion of a cross section. The two direct measurements are associated with rating curves that provide mean velocity and the area of the channel at the gaging site. The construction of the index-velocity rating uses regression technique applied to calibration data obtained from field measurement campaigns. Preliminary analysis is applied to the data acquired to construct the index-velocity rating curve to decide if the regressions are functions of one or multiple variables. The stage-area rating is developed analytically using the surveyed cross-section as input. The outputs from the two ratings are multiplied to compute a discharge for each stage and index-velocity measurement pair. New guidelines for IVRC implementation using acoustic instruments have been recently developed (e.g., [Levesque, 2012]). The performance of IVRC method in steady and unsteady flows is still under scrutiny ([Kastner, 2015], [LeCoz, 2014]).
Continuous slope-area method (CSA). The conventional slope-area (SA) method is typically used to extend the stage-discharge rating curve to high flows using high water marks produced during flood events. The method requires measurements of the stream stage at minimum two locations where the stream cross section is surveyed. The availability of low-cost recording pressure transducers, the method is used for continuous measurement of stream flows [Smith, 2010].
4.3 Technologies for near-real-time measurements, leakage detection and localization
According with National Oceanic and Atmospheric Administration (NOAA) the climate, weather, ecosystem and other environmental data (used by scientists, engineers, resource managers, and policy makers) face with an increasing volume and diversity and create substantial data management challenges. As support for all defined objectives we will consider the main nine principles for effective data management presented by NOAA [Herlihy, 2015]. During the first phase of the project, we will analyse the specific guidelines that explain and illustrate how the principles could be applied.
- Environmental data should be archived and made accessible;
- Data-generating activities should include adequate resources to support end-to-end data management;
- Environmental data management activities should recognize user needs;
- Effective interagency and international partnerships are essential;
- Metadata are essential for data management;
- Data and metadata require expert stewardship;
- A formal, on-going process, with broad community input, is needed to decide what data to archive and what data not to archive;
- An effective data archive should provide for discovery, access, and integration;
- Effective data management requires a formal, on-going planning process.
NOAA is projecting a sharp increase in the volume of archived environmental data, from 3.5 petabytes in 2007 to nearly 140 petabytes (140 billion megabytes) by 2020 (see Figure 5). The notion of open data and specifically open government data - information, public or otherwise, which anyone is free to access and re-use for any purpose - has been around for some years. In 2009 open data started to become visible in the mainstream, with various governments (such as the USA, UK, Canada and New Zealand) announcing new initiatives towards opening up their public information. Open data is data that can be freely used, reused and redistributed by anyone - subject only, at most, to the requirement to attribute and share alike. The full Open Definition gives precise details as to what this means. To summarize the most important:
- Availability and Access: the data must be available as a whole and at no more than a reasonable reproduction cost, preferably by downloading over the internet. The data must also be available in a convenient and modifiable form.
- Reuse and Redistribution: the data must be provided under terms that permit reuse and redistribution including the intermixing with other datasets.
- e-Universal Participation: everyone must be able to use, reuse and redistribute - there should be no discrimination against fields of endeavour or against persons or groups. For example, ‘non-commercial’ restrictions that would prevent ‘commercial’ use, or restrictions of use for certain purposes (e.g. only in education), are not allowed.
Figure 5. Archived environmental data: past, present and future (SOURCE: NOAA, 2007).
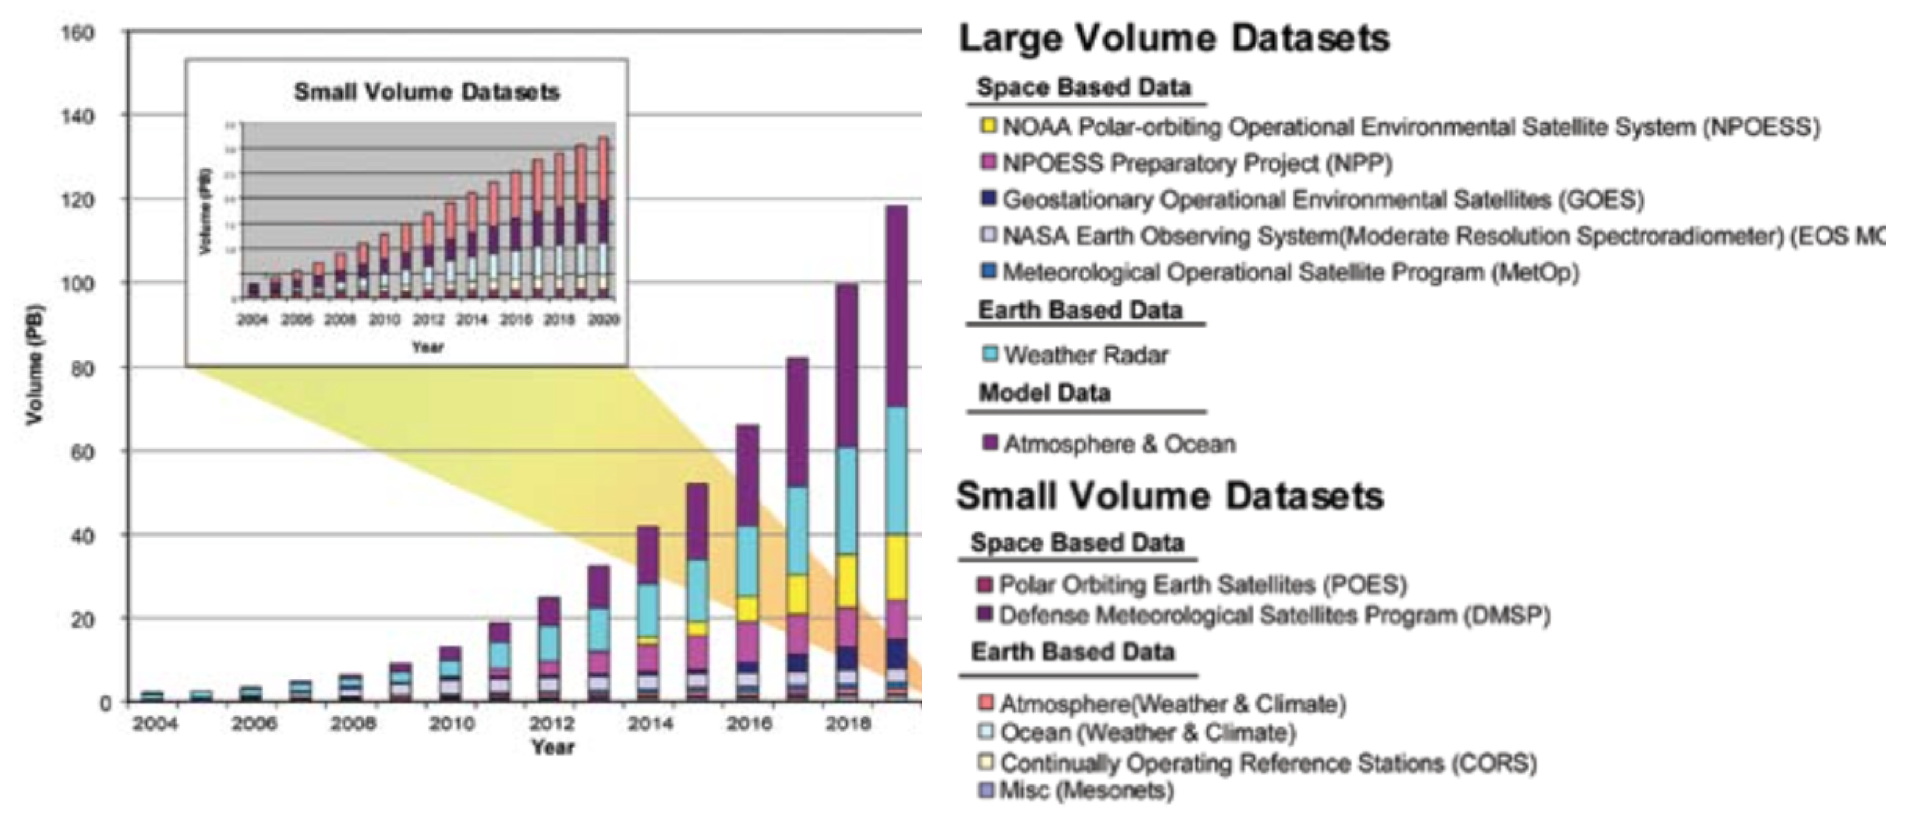
Standardization, implementation and integration of monitoring platforms based on sensors, exiting e-services for environmental support represents the main technical challenge in implementing integrated platforms for data acquisition.
Technologies for near-real-time measurements follow the model of hierarchical pipeline processing. A general model for leak detection and localization method was proposed in [Wan, 2011]. The model is able to separately achieve multiple different levels of leak information processing, which ensures the accuracy and reliability of the diagnosis results. The whole flow model is presented in Figure 6.
Figure 6. Hierarchical model for near-real-time measurements and processing.
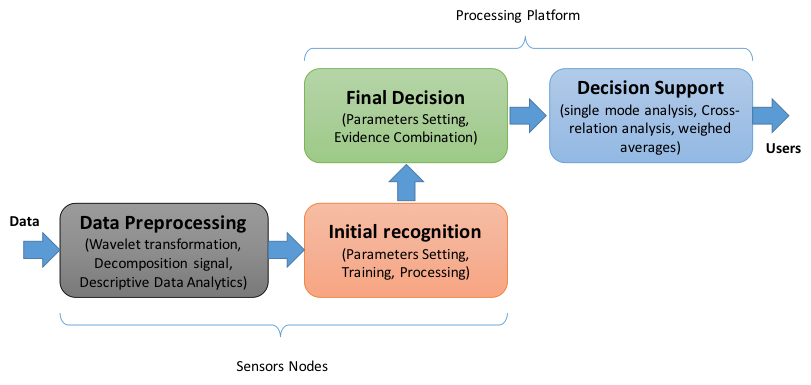
This is a general model, and according with signal processing, model estimation and knowledge we can divide existing pipeline leak detection and localization methods into three categories: Methods Based on Signal Processing, Methods Based on Model Estimation, Methods Based on Knowledge. All these methods use different techniques for data processing, initial recognition, final decision and leak localization ware depicted in Figure 7.
Figure 7. Leak detection and localization methods.
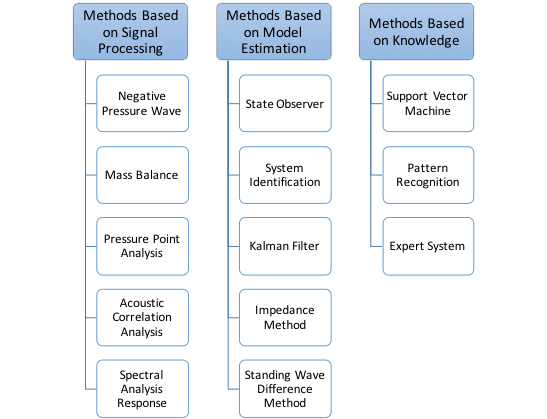
For example, In-Situ® Products offers solution for real time groundwater monitoring with the following capabilities: Measure and log all required parameters, Monitor performance indicators in real time, Monitor radius-of-influence in real time with the Virtual HERMIT Kit and vented cable extender.
4.4 Cloud Architecture – Datacenters and in-memory computing
Another challenging issue is to provide real-time analysis of shared and distributed data. While most real-time processing engines including Spark [Zaharia, 2012] and S4 [Neumeyer, 2010] can efficiently benefit of the un-debatable performance of in-memory processing, they don’t consider the data management during data processing (i.e. where to store the intermediate temporary data) or dependencies in-between processed data, which are common in environmental applications. We aim to explore the trade-off between fast in-memory processing, data management in-between applications, and the network latency.
Map Reduce paradigm, widely used programming model for handling large data sets in distributed systems, has some shortcomings when thinking about iterative processes: machine learning iterative steps or iterative queries on the same dataset loaded from multiple sources [Engle, 2012]. Spark has been developed to solve the problems that Map Reduce has with working sets, while providing similar capabilities in terms of scalability and fault tolerance. Spark is based on the resilient distributed datasets (RDDs) abstraction. RDDs represent a collection of records, read-only and partitioned, built using deterministic steps or other RDDs and they "know" the information on how they were derived. The users may specify the partitioning of the RDDs and the persistence (if the RDD should be kept in-memory). The benefits of the RDDs are:
- RDDs are read-only: allow fault tolerance without the overhead of check pointing and roll- back (the state may be restored on nodes in parallel without reverting the program execution);
- Are appropriate to run backup tasks: don’t have to handle concurrent updates;
- Use data locality for scheduling in bulk operations (doesn’t handle conflicts - no updates);
- If there is not enough memory, the RDDs are stored on the disk. In [Engle, 2012] it is described an implementation of Spark on Hive - Shark. Shark is a data warehouse implementation based on RDDs, with the following improvements: exploit inter-query and intra- query temporal locality (machine learning algorithms), exploit the cluster’s main memory using RDDs.
GraphX computation system [Xin, 2015] extends the Spark RDDs abstraction to RDG (Resilient Distributed Graph) to distribute efficiently graph data in a database system and uses Scala integration with Spark to allow users to process massive graphs. RDGs support graph operations on top of a fault-tolerant, interactive platform, provided by Spark; represent RDGs in an efficient tabular model. RDGs were used as a base to implement PowerGraph and Pregel frameworks.
The main idea for in-memory computing is to keep data in a distributed main memory near to the application code, ready to be processed. This approach appeared over 20 years ago, but the main memory was very expensive, and also there was no motivation to implement an in-memory computing framework. The drop in RAM costs and increasing need for real-time processing of big-data represented an incentive for this model to be developed. The data is stored in an in-memory database, and the processing is performed in the platform layer, a distributed in-memory database system.
In-memory storage and query solutions are in-memory databases (IMDBs) and in-memory data grids (IMDGs). IMDBs move the data to be queried in the main memory. There are native IMDBs (HANA or Altibase) or traditional DBs with in-memory extensions (Oracle). For IMDGs, the data may be processed in a distributed system of commodity servers, using the Map Reduce framework. An important point is the difference between in-memory computing and in-memory databases and data grids. In-memory computing is a paradigm that deals with computing, too and takes into account scheduling tasks and deciding whether to move the data near the code or the code near the data; in contrast to the data solutions that deal only with data. In-memory data solutions can be used as building blocks for an in-memory computing solution.
Cloud-based Applications
In water management information systems a very important challenge is to be able to provide reliable real time estimation of the degree of water pollution. Sometimes professional software that simulates pollutant transport (such as DHI’s MIKE11) is not available for various reasons. The focus of article [Ciolofan, 2017] was the design and implementation of system able to accurately assess the concentration of the pollutant at any points along a river in respect to a given pollution scenario. This system reuses historical offline data resulted from previous executions of MIKE11 software. The pollution scenario is determined by a set of user specified input variables (chainage, pollutant concentration, discharged volume, type of pollutant, etc). In order to compute the result the authors used multivariate interpolation. The validation of the system was done using data from a real use case on Dîmboviţa river. The obtained results have a mean percentage error less than 1.3%. To efficiently cope with millions of records, the computing intensive application was deployed on Jelastic Cloud in order to take the advantage of on demand elastic RAM and CPU resources.
4.5 Mobile Cloud computing
Mobile cloud computing is a new paradigm that evolves from cloud computing. This paradigm is triggered by the increasing number of smartphone users and the inherent smartphone constraints, such as limited computational power, memory, storage and energy [Khan, 2014]. To gain the benefits of mobile cloud computing, computation offloading can be used to migrate resource intensive computational tasks from a mobile devices and sensors (used to collect environment data) to the cloud. We aim to investigate mobile-agent based computation offloading techniques that allow the partitioning of the application and the collected data into sub-partitions in order to facilitate the distribution of execution between the mobile devices and cloud [Aversa, 2012].
4.6 IoT trends and relation to Water Management
Nowadays, the Internet of Things (IoT) has become for many of us a new image of how the future will look like in the upcoming years, since, during each of the past few years, the number of devices that can have Internet access has been consistently increasing. More and more devices and sensors are interconnected; they can be easily controlled remotely, and the multitude of data types being generated lays the groundwork for outstanding opportunities in terms of innovative products and services.
IoT Platform-as-a-Service (PaaS) providers ensure that all data collected by sensors or other similar devices is received and sent to other services where it can be stored, viewed, analyzed and used to generate a response for other devices, in a highly available, scalable and secure way. The providers also offer software developments kits (SDKs) that help developers to quickly connect hardware devices to their platform. Naturally, there are many suppliers on the market that provide powerful IoT PaaS services, such as Amazon AWS IoT, Microsoft Azure, Google Cloud Platform, or IBM Watson Internet of Things. Adhering to similar architectural principles, they use the following components: message broker, rule engine module, security and identity module, a module that knows the state of sensors or connected devices. Each provider supports bidirectional communication between hardware devices and platform, but with different implementations. Amazon uses a message queue to send messages to a device that is subscribed to a certain topic. On the other hand, Azure provides two endpoints that are used to send and receive data. All mentioned platforms use the HTTP and MQTT protocols. Another important aspect of IoT platforms is given by the SDK languages support. IBM Watson IoT and Azure offer SDKs for Java, C#, Python, NodeJS and C, while AWS only for C and NodeJS.
Nevertheless, despite their undeniable strengths, the aforementioned solutions suffer from a common condition. Clients who desire to use their services, besides having to program their hardware in the supplier’s paradigm, must also possess knowledge on how to create their own piece of application to interpret the raw data received.
There are other several other projects which try to address these issues, such as Kaa IoT, a flexible, multi-purpose, open-source middleware that offers features similar to AWS or Azure IoT. The main advantage is given by the possibility to be hosted in private, hybrid or public clouds. Kaa provides the possibility to store data on Apache Cassandra and MongoDB but comes up short in regard to filling the client-technology gap.
The problems described above were also indicated by Gartner in a 2016 report (Iot adoption is driving the use of platform as a service - press release), which suggests that, because of the existent gaps, companies would rather prefer to develop an in-house container service. It is also predicted that this approach will fail to meet expectations through 2018, leading to a major shift towards high-productivity and high-control PaaS options, generically defined as hpaPaaS (High-Productivity Application Platform as a Service).
Fortunately, such specialized products today started appearing also for Water Management. For example, Libelium, one of the biggest IoT HW producers in Europe, commercializes an off-the-shelf Smart Water Sensors to monitor water quality in rivers, lakes and the sea. Equipped with multiple sensors that measure a dozen of the most relevant water quality parameters, and using cellular (3G, GPRS, WCDMA) and long range 802.15.4/ZigBee (868/900MHz) connectivity to send information to the Cloud, the Waspmote Smart Water is a water quality-sensing platform to feature autonomous nodes that connect to the Cloud for real-time water control.
Figure 8. The Libelium Waspmote Plug & Sense! Smart Water model.
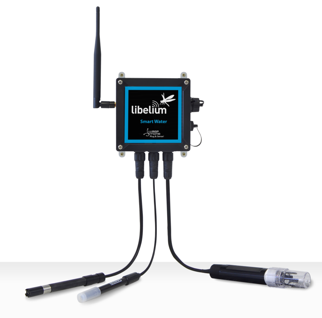
Waspmote Smart Water is suitable for potable water monitoring, chemical leakage detection in rivers, remote measurement of swimming pools and spas, and levels of seawater pollution. The water quality parameters measured include pH, dissolved oxygen (DO), oxidation-reduction potential (ORP), conductivity (salinity), turbidity, temperature and dissolved ions. It can actually be used as a portable water monitoring unit and can be quickly linked to the Libelium dashboard for on-the-spot data visualization.
Another interesting ready-to-use IoT product is the Blue Isles BiomeHM-IA IoT Water Monitoring Buoy that can monitor water quality in real time from any remote location, helping to proactively manage and ensure your successful marine farm production or marine environment monitoring.
Figure 9. BiomeHM-IA being used for Remote Aquatic Monitoring.
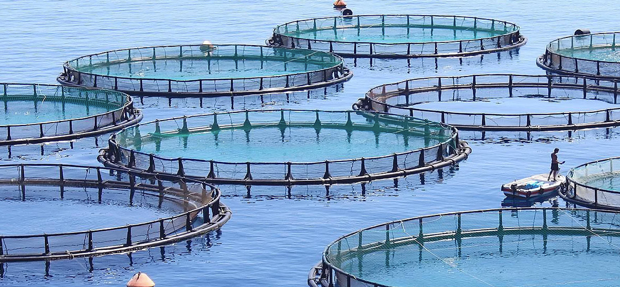
The Blue Isles BiomeHM-IA™ Buoys exports data in real time. It has integrated solar panels which charge an internal battery which in turn powers your sensor of choice and the cellular gateway. Reports are stored in the cloud so viewing the data is easy.
In general, Industrial IoT sensor monitoring can help smart cities with effective Flood Warning Systems. We’ve got a lot of options today for how to monitor water levels. Typically, ultrasonic sensors send out sound waves to determine fluid levels, whether your organization is monitoring chemicals in tanks or measuring river water levels from a bridge. Ultrasonic sensors measure how much time it takes for the echo to hit the target (e.g., water) and return to the sensor.
Figure 10. Ultrasonic Level Sensors for water monitoring.
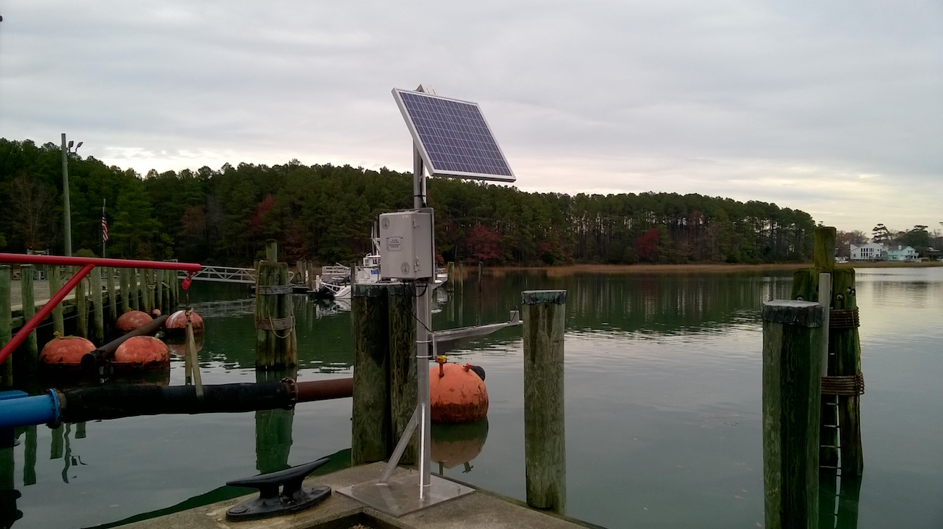
Unlike this, radar sensors use probes to guide high frequency radar and electromagnetic waves from the sensor to what you’re monitoring the level of, e.g., water. Based on how long the radar pulse takes to return after it’s been sent, radar level sensors output your level readings. Typically, radar sensors are more expensive than other types of level sensors. However, waves and pulses output by radar sensors can often penetrate things that might interfere with true level measurements, e.g., foam or vapor. For this reason, one has to decide which level sensors, or combinations of level sensor technologies, will work best depending on specific scenarios.
In IoT environments many sensors produce large quantities of data that require to be processed in real-time. Such situations may be found in several important domains, such as smart farming, water management or smart cities. The authors of [Dincu, 2016] studied the main approaches of handling the sensor data processing in several use cases and proposed an implementation based on an open source distributed stream processing framework. The first objective was to place two of the most widely used processing engine frameworks in a smart farming context. The authors performed several benchmarks and uncovered some of the limitations of the software from multiple perspectives like performance and scalability. The second objective was to propose solutions to exceed these limitations by developing an optimized scheduling algorithm that enhances the scalability of the system and provides lower overall latency. The overall solution has the capacity to store and process historical data for advanced analytics. The effectiveness of the solution has been validated by experiments in a large cluster, using data from sensors within a smart farming. While the experiments had been limited to sensor data obtained from greenhouses, the solution can be easily generalized to multiple IoT domains.
Traditional IoT systems have been built as isolated solutions for each problem domain. However, many of such systems usually share common spatial-temporal resources. For example, water management systems and farming systems can operate on the same land surfaces while weather conditions might affect both. In this sense the global IoT vision aims to integrate distinct problem domains into a unified network in order to offer enriched context and meaningful correlations. The global information technology platforms accommodating multiple IoT sensor network will therefore have increased data processing requirements. Paper [Huru, 2018] presents the main technical challenges and non-functional requirements demanded by such a platform. The authors propose a cloud-based data processing architecture able to cope with these requirements. This solution integrates a collection of frameworks and offers enhanced reusability and scalability in a multi-tenant setup. It relies on a service-oriented architecture and offers real-time processing capabilities, advanced reasoning and auto-scaling. In the end the authors validated the solution with a reference implementation and demonstrated that it can accommodate an IoT solution where cross-domain correlations can be done and a bigger picture is revealed.
4.7 Fault tolerance - faults are the norm not the exception
Failure and network partitions are common in large-scale distributed systems; by replicating data we can avoid single points of failure. Replication has become an essential feature in storage systems and is leveraged extensively in cloud environments [Ghemawat, 2003]: it is the main reason behind the high availability potential of cloud storage systems. An important issue, we need to consider in geo-replicated storage systems, is data consistency. As strong consistency by means of synchronous replication may limit the performance of some applications, relaxed consistency models (e.g., weak, eventual, casual, etc.) therefore have been introduced to improve the performance while guaranteeing the consistency requirement of the specific application [DeCandia, 2007][Cassadra, 2009].
With the unpredictable diurnal/monthly changes in the data access and the variation of the network latency, static and traditional consistency solutions are not adequate [Li, 2012][Peglar, 2012]. Therefore, few studies have focused on exploring adaptive consistency models for one specific application [Chihoub, 2012]. However, environmental applications exhibit complex data access affinity, more importantly, data are shared by multiple applications which have a mix of consistency requirements, consequently, our goal is to study new metrics and configurable consistency models to maintain a high rate of consistency of shared data in geo-replicated storage systems while improving performance and throughput of multiple applications. Moreover, as the speed and size of generated data is rapidly growing, we intend to explore new techniques based on erasure coding to reduce the storage capacity while maintaining high data availability.
4.8 Integrated approaches for watershed management
Integrated Water Resources Management (IWRM)
According to the GWP [GWP, 2004], IWRM is a stakeholder-driven process for promoting coordinated activities in the pursuit of common goals for multiple objective development and sustainable water resources management. IWRM addresses the full range of physical, biological, and socioeconomic variables related to land and water resources within a watershed. Therefor IWRM supersedes traditional multi-purpose natural resources management (such as the multi-sectorial approached by Tennessee Valley Authority in early 1950s, by explicitly combining societal goals and ecosystem functions [Ballweber, 2006].
Taking advantage of the recent advancements in information and communication technologies, the IWRM community has recently proposed the adoption of the digital observatory framework for a conducting integrated science-research-management in the water resources. A digital observatory (DO) is an electronic representation of watersheds and their processes are documented by data, the spatiotemporal representation of the data, simulation models, and the analysis and synthesis of the available data and information [Muste, 2012]. DO’s must embrace the best available information to provide the digital description of the natural environment and the man-made constructed infrastructure (e.g., dams, water abstraction, and discharge systems) using a variety of data sources. DO’s comprise data servers and software tools that aggregate third party data acquired by various federal and state agencies with local data (including academic settings) in a system that is open, easy to use, and enables integrated analysis and modelling.
Currently, the decision-making processes in water resources management is undergoing major transformations during its transition from the sectorial approaches of the past (e.g., water use for only irrigation, hydropower, or navigation) to contemporary ones that are integrative and comprehensive approaching watersheds as complex system with interrelated processes surrounding the water cycle. This transformation comes at a time when acute problems are rising in water resources by direct (land use change) or indirect (climate change) human interventions in the natural systems within which we live. Among the most obvious example of extreme events related to water are floods, droughts, excessive pollutant in streams, and an increasing demand of fresh water to sustain economic and social needs. Past disaggregation of surface- and groundwater, as well as separately addressing concerns about water quality and quantity, can be problematic when considering multiple water resources management objectives. The traditional single-objective focused watershed management of the past with primary emphasis on short-term economic development has oftentimes led to inefficient expenditure, to exclusion of consideration of multiple benefits, and ultimately to costly restoration efforts. In recent years, the failure of the conventional fragmented and sector-based water resources management approaches to attain sustainability of the environment along with the well being of the communities have boosted public awareness, thus highlighting the need for a radical departure from long-established ways of managing natural resources. Currently, worldwide water policy and management have come to address the fundamentally interconnected nature of watershed resources using a holistic, integrated approach to water management, whereby the whole watershed system is taken into account. This includes the relationships and dynamic interactions between land and water systems, the human and natural systems, and key relationships among watershed stakeholders.
The complexity of research related to water resources management is extremely high and requires deep expertise in several ICT-related research domains such as: Big Data and Smart Data; semantic Internet of Things; context-aware and event-based systems; Cloud computing; Web services; and social Web. The dynamics of water and the role of humans in the water cycle are not well understood largely because environmental and socio-economic analyses have traditionally been performed separately; and the methods, tools, and data needed for multidisciplinary work are not yet at the required level to satisfactory address problems posed in managing resources in aquatic environments.
ICT can contribute to several areas of research such as better understanding of coupled human-natural system dynamics; finding risk mitigation measures for the unintended consequences and side effects like water scarcity, increased pollution, unreasonable use of water, flood, food prices; and can contribute to the development of strategies for efficient use of water resources. There are situations when information is to be accessed only by designated stakeholders, but there is a huge amount of information that is, and should be handled, as public information. There are already regulations, at national, European or international level, that oblige decision making actors related to water resource management, to ensure the access of the population at certain types of information.
Adaptive Management (AM)
According to [Williams, 2007], AM is a systematic approach for improving resource management by learning from management outcomes. AM is a process of sequential activities that include: exploration of alternative ways to meet management objectives, predicting the outcomes of alternatives based on the current state of knowledge, implementing one or more of these alternatives, monitoring the impacts of management actions, and finally adjusting the management actions based on the knowledge inferred from the monitoring results [Marmorek, 2003]. AM is not a simple ‘trial and error’ process, but rather emphasizes learning and adaptation, through partnerships of managers, scientists, and other stakeholders who work together to devise ways for creating and maintaining sustainable resource systems. Adaptive management does not represent an end in itself, but rather a means to more effective decisions and enhanced benefits. Its true measure is in how successful it is in helping to meet environmental, social, and economic goals; to increase scientific knowledge; and to reduce tensions among stakeholders.
Figure 11. Components of the integrative approaches: a) IWRM (http://wvlc.uwaterloo.ca); b) AM (adapted from [Raadgever, 2006]).
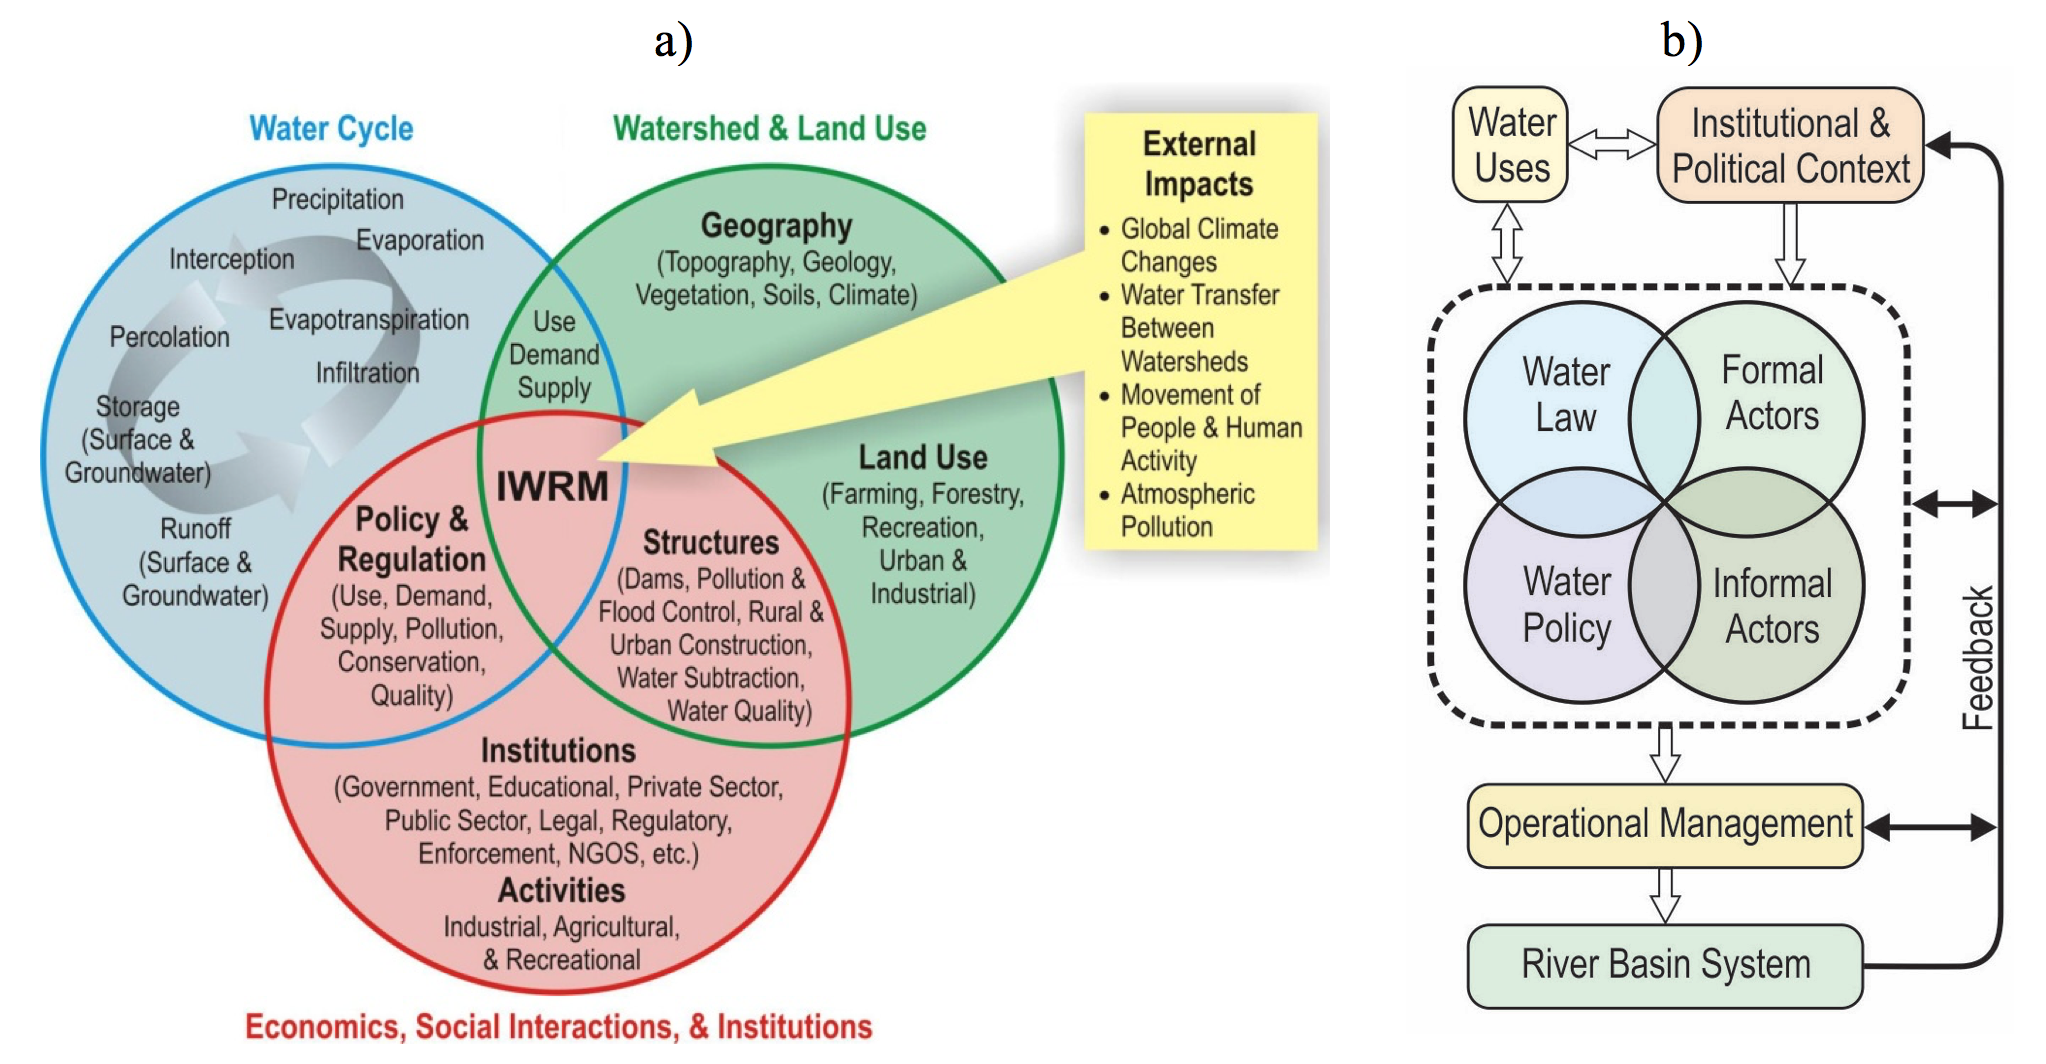
Optimization of Water Reservoir Operation
Accidental water pollution causes important economic losses, not to mention tragic events such as deaths or injuries. One effective measure that can be taken is to reduce the concentration of pollutant in the river water by adding clean water released from dams placed on tributaries of the river. In article [Ciolofan, 2018] the authors focus on finding an optimal operation of the water reservoirs (such as opening/closing time of the gates) with the goal of minimizing the total cost of the economic damages.
The total cost function is proposed as a sum of two components: the cost of the water released for dilution and the economic losses caused by the river's water pollution. Further the authors formalized the problem in terms of a non-linear multi-objective simulation - optimization model, subject to constraints. The proposed solution is evaluated for a real use case (Jijia River, respectively Dracsani and Halceni reservoirs in N-E Romania). The results of the two experiments conducted have shown that by using the proposed optimization solution, the total cost of economic losses may be reduced almost six times as compared with an empirical operation of the reservoirs, and by almost ten times if no dilution takes place.
4.9 Information-centric systems (ICS) for watershed investigation and management
Recent advances in information science and cyber-infrastructure have set the stage for a new information-knowledge generation technology that can facilitate an “information-centric” approach for watershed investigation and management that capitalizes on observations and their interpretation [Marmorek, 2003]. This new approach differs fundamentally from the “observation-centric” and “model-centric” strategies of the past, whereby water cycle components were viewed independently and uncorrelated with the bio-geo-chemical processes supported by it. Systematic integration of the water-relevant data into a dedicated system allows to uniquely couple hydroscience information with other water-allied disciplines, such as economics, political and social sciences, in a common information system [Waters, 2008], [Lee, 1993] and management practice. These integrative systems enhance the understanding of ecosystems and the management of the natural and built environment through a participatory approach that ensures continuous stakeholder involvement.
There is a wide variety of users and associated interests and some of the tools for handling data and information to support management and policy developments during IWRM implementation. It includes managers, accountants, engineers, operators, solicitors, surveyors or scientists. At this time, there is no unified vision on the components, their role and functions, and the enabling technologies to accomplish integrative management approaches. Moreover, there is no guidance of what components should be developed first and in what integration order. It is emphasized herein, that IWRM is not just a conceptual and academic exercise and it can be only attained by giving proper consideration to the nature of information requirements to support IWRM and by identifying the “enabling technology” to fulfill those requirements as one of the first priority. The need to set data and information for supporting IWRM as a high priority was clearly documented in [Muste, 2010]. It can be said that the lack of progress in informatics-related aspects of IWRM may be part of the slow implementation pace perceived by some of its critics. Overlooking of the above aspects contrasts with the considerable intellectual and financial efforts carried out to clarify IWRM concepts and functions and for putting in place the necessary political structure and institutional framework for IWRM implementation. It is quite obvious that the fully integrated water resources management is not limited by a lack of conceptual framework, but because the operational problems have not received sufficient attention in the past.
Hydroinformatics-based systems are computer-centered platforms quasi-equivalent to CI-based ones focused on water related problems in the environment, therefore the terms are interchangeable. These integrate CI tools and methods in a digital environment that facilitates the conversion of the data into information and subsequently into knowledge through customized workflows. The fusion of data and numerical simulation is the most powerful tool to generate information that managers use to monitor, predict, and warn the public in extreme events. Recently, data-driven modelling is increasingly used for the same purposes [Damle, 2007]. Engineers continue to have important responsibilities to build, calibrate, verify, validate and apply models. Collaborative models are also used for prediction, assessments of alternative scenarios, and multi-criteria indicators that are also used for the decision-making process.
In the last two decades, the decision-making in water resources systems management has been influenced by the introduction of the sustainability paradigm [Simonovic, 2009]. Savenije and Hoekstra [Savenije, 2002] indicate that the watershed sustainability is only accomplished when the resource base and water use are each sustainable. The first aspect is accomplished by closing of the water, nutrient, soil and energy cycles, building up societal assets (know-how, knowledge, technology, infrastructure welfare, civic society, educational and legislative capacity). The second one is reached by imposing zero tolerance on pollution, complete recycling (agriculture, industry, household), water conservation and retention, water sector reform (good governance and institutional framework, education, participation).
Some of the most important ICS contributions to sustainable management of watersheds are:
- Improvement of the information services;
- Development of operational science for decision making;
- Enhancing the human dimension in the management process;
- Supporting capacity building;
- Fostering institutional and governance adjustments.
Figure 12. ArcGIS architecture.
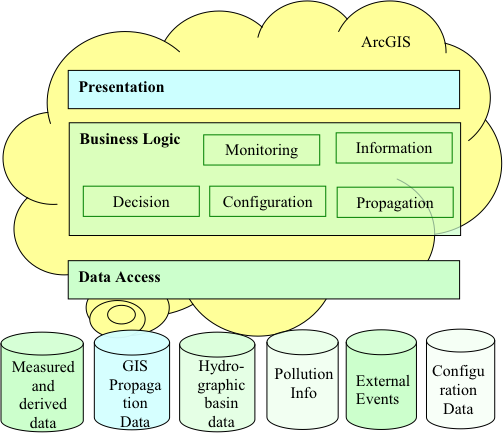
4.10 Supervisory control and data acquisition systems
Supervisory control and data acquisition (SCADA) systems are used for gathering real-time data, monitoring equipment and controlling processes in industrial facilities and public utilities, including, among others, water and sewage treatment plants [NCS, 2004]. They include servers, capable to communicate with sensors and control devices, located with some water plants or at remote locations, or with whatever equipment needs to be monitored or controlled. A SCADA network, serving the SCADA system, can cover large geographical areas, especially in the case of public utilities.
A SCADA system generally includes three kinds of components: the field devices, the server(s), and the client machines. Field Devices include sensors and controllers (e.g., Remote Telemetry Units (RTUs) and programmable logic controllers (PLCs), or a combination of both). Sensors are used to collect data from various sources. Controllers perform actions (e.g. starting a pump or closing a valve) based on sensor data and implemented control algorithms. RTUs and PLCs are small dedicated devices, which are hardened for outdoor use and industrial environments. They may be interfaced using serial connections or Ethernet.
Servers are responsible for collecting and analyzing various field inputs. They are responsible for raising alarms, starting and stopping processes, and implementing the logic required to automate processes.
Finally, client machines can interact with the servers via terminals (direct access) or Web-based protocols (remote access). Clients usually monitor the state of a SCADA network, and have the ability to start and stop processes running within the network. SCADA systems have traditionally used combinations of radio and direct wired connections. The remote management or monitoring function of a SCADA system is often referred to as telemetry. SCADA protocols are designed to be very compact. Many are designed to send information only when the master station polls the RTU. Typical legacy SCADA protocols include Modbus RTU, RP-570, Profibus and Conitel. These communication protocols are all SCADA-vendor specific but are widely adopted and used. Standard protocols are IEC 60870-5-101 or 104, IEC 61850 and DNP3. These communication protocols are standardized and recognized by all major SCADA vendors. Many of these protocols now contain extensions to operate over TCP/IP.
SCADA systems have evolved through several generations [Karnouskos, 2011]. Early SCADA system computing was done by large minicomputers. With the advent of distributed systems, SCADA information and command processing was later on distributed across multiple stations, which were connected through a LAN. Information was shared in near real time. Each station was responsible for a particular task, which reduced the cost as compared to monolithic-generation SCADA systems. But the network protocols used were still not standardized.
Later on, SCADA designs were adapted to large networks, where the system may be spread across more than one LAN network called a process control network (PCN) and separated geographically. Several distributed architecture SCADAs running in parallel, with a single supervisor and historian, could be considered a network architecture. This allows for a more cost effective solution in very large scale systems.
Finally, today, we witness the Internet of Things generation of SCADA systems. With the commercial availability of cloud computing, SCADA systems have increasingly adopted Internet of Things technology to significantly reduce infrastructure costs and increase ease of maintenance and integration. As a result, SCADA systems can now report state in near real-time and use the horizontal scale available in cloud environments to implement more complex control algorithms than are practically feasible to implement on traditional programmable logic controllers. Further, the use of open network protocols such as TLS inherent in the Internet of Things technology provides a more readily comprehensible and manageable security boundary than the heterogeneous mix of proprietary network protocols typical of many decentralized SCADA implementations. One such example of this technology is an innovative approach to rainwater harvesting through the implementation of real time controls (RTC).
This decentralization of data also requires a different approach to SCADA than traditional PLC based programs. When a SCADA system is used locally, the preferred methodology involves binding the graphics on the user interface to the data stored in specific PLC memory addresses. However, when the data comes from a disparate mix of sensors, controllers and databases (which may be local or at varied connected locations), the typical 1 to 1 mapping becomes problematic. A solution to this is Data Modelling [Mercurio, the concept derived from object oriented programming.
In a Data Model, a virtual representation of each device is constructed in the SCADA software. These virtual representations (“Models”) can contain not just the address mapping of the device represented, but also any other pertinent information (web based info, database entries, media files, etc.) that may be used by other facets of the SCADA/IoT implementation. As the increased complexity of the Internet of Things renders traditional SCADA increasingly “house-bound,” and as communication protocols evolve to favour platform-independent, service-oriented architecture (such as OPC UA), it is likely that more SCADA software developers will implement some form of data modelling.
To give an example of the kind of challenges faced, we consider here the case of the Australian SCADA system for water management, one of the very complex, because of the vastness of the country and the remoteness of many of the water utility plants and field stations. It is famous due to the system breach occurred at Maroochy Water Services on Queensland’s Sunshine Coast in Australia [Hughes, 2003]. In March 2000, Maroochy Shire Council experienced problems with its new wastewater system. Communications sent by radio links to wastewater pumping stations were lost, pumps were not working properly, and alarms put in place to alert staff to faults was not going off. While initially it was thought there were teething problems with the new system, an engineer who was monitoring every signal passing through the system discovered that someone was hacking into the system and was deliberately causing the problems. The perpetrator, Vitek Boden, used a laptop computer and a radio transmitter to take control of 150 sewage pumping stations. Over a three-month period, he released one million liters of untreated sewage into a stormwater drain from where it flowed to local waterways. The attack was motivated by revenge on the part of Mr. Boden after he failed to secure a job with the Maroochy Shire Council. The Maroochy Water Services case has been cited around the world as an example of the damage that could occur if SCADA systems are not secured. The incident was mentioned in a recent report on IT security by the U.S. President’s Information Technology Advisory Committee [US, 2005].
The Maroochy SCADA system included two monitoring stations and three radio frequencies to control the operations of 142 sewage pumping stations. During the attack, the system experienced several faults [Mustard, 2005]: unexplained pump station alarms, increased radio traffic that caused communication failures, modified configuration settings for pump station software, pumps running continually or turned off unexpectedly, pump station lockups and pumps turned off without any alarms, and computer communication lockups and no alarm monitoring. For such manifestations, it was easier for the engineers to blame installation errors. However, upon reinstalling all the software and checking the system, they noticed that pump station settings kept changing beyond the ability of the system to do this automatically. Therefore, they concluded that an external malicious entity was responsible. With the help of advanced monitoring tools, they determined that a hacker was using wireless equipment to access the SCADA system. The analysis of the incident made several important points. First, it is very difficult to protect against insider attacks. Second, radio communications commonly used in SCADA systems are generally insecure or are improperly configured. Third, SCADA devices and software should be secured to the extent possible using physical and logical controls; but it is often that case that security controls are not implemented or are not used properly. Finally, SCADA systems must record all device accesses and commands, especially those involving connections to or from remote sites; this requires fairly sophisticated logging mechanisms.
Today, several technical solutions are already available for securing SCADA systems. The solutions vary in their coverage and may not be very robust; nevertheless, they are good starting points for implementing security in SCADA systems. Due to their specialized architecture, protocols and security goals, it is not appropriate to simply apply IT security techniques and tools to SCADA systems. Instead, it is important to design security solutions catered specifically to SCADA systems. For example, tools that understand SCADA protocols and are designed to operate in industrial environments would be able to identify and block suspicious traffic in a more efficient and reliable manner.
Peterson [Peterson, 2004] discusses the need for specialized intrusion detection systems for SCADA networks. Most existing systems only pick up traditional attacks, e.g., an attacker attempting to gain control of a server by exploiting a Windows vulnerability; effective intrusion detection systems must also incorporate SCADA attack signatures. Likewise, SCADA-aware firewalls must also be developed; their specialized SCADA rule sets would greatly enhance the blocking and filtering of suspicious packets. Peterson also emphasizes the need for logging activities and events in SCADA systems. Logs can provide valuable information pertaining to attacks. This includes information about the escalation of user privileges in SCADA applications, failed login attempts, and disabled alarms and changed displays, which could fool operators into believing that a system is running normally.
In addition to investing in security techniques, mechanisms and tools, it is imperative to focus on the human aspects of SCADA security. Staff must be well trained and should be kept abreast of the latest security practices, exploits and countermeasures. Security policies and procedures should be developed, refined periodically, and applied consistently. Only the combination of technological solutions and human best practices can ensure that SCADA systems are secure and reliable.
4.11 Decision Support Systems
Decision-support systems for water community-driven efforts
The current stresses on the waterscape have energized the creation of top-down and bottom-up interjurisdictional alliances that aim to collectively improve the status of watersheds and the search for sustainable solutions. By nature, effective watershed management requires information-rich communication among federal, state, and local governments, private industry, citizens, and academia [Muste, 2014]. Effective watershed planning, regulation and management also require timely conveyance of information to agency staff, decision makers, and the public. Customized Decision Support Systems (DSS) are required for this purpose to efficiently provide a wide access of workflows for querying, visualizing, and compare decision options. The data and information include real-time sensor data streams, inferences from the data, multi-domain modelling results, analyses results, user-defined inputs, and tools for evaluation and aggregation of unstructured data. A DSS can use the same information for strategic or emergency planning if the access to the data, simulations, and workflow operation are completed promptly, and ideally, in real-time. This type of customized DSS for water resources can uniquely meet the demand being put on governmental and local agencies to provide sound, cost-effective, and timely solutions by aligning existing resources in a way that allows to efficiently build on past efforts, leverage costs and resources, and continuously integrate products from new studies with minimum effort and resource investments. The platforms are actually acting as “enabling technologies” for benefiting effective integrated watershed management and ensure the decision-making sustainability.
Sound and efficient management decisions for timely mitigating accidental pollutant releases in rivers require a plethora of prerequisites, tools, and organization of the data and information in a manner that allow elaboration of the decisions in real time. Among the basic prerequisites for making sound decisions are: good knowledge of the pollution sources and their types, maximum allowed local concentrations for pollutant at each river location, maximum allowed concentration for safeguarding downstream water users and ecosystems, and the estimation of the pollutant mass and travel time in the river system for various accidental spillway scenarios. Pollutant mitigation strategies can take various forms: absorbents barriers, chemical neutralization, increasing the pollutant dilution by releasing water from the upstream reservoirs, etc. Establishing the most adequate strategy in each case of accidental pollution should be done in advance based on mathematical modelling. Since the accidental pollution is inherently unexpected, the sensors deployed in the river should be ideally equipped with real-time and unassisted transmission to promptly alert on any change in pollutant concentration and their relationship with threshold levels. This input information should be quickly passed to simulation models to enable quick decisions and formulation the needed warning messages for users. If all the above-described elements can be integrated in a computer-based system accessible through Internet we attain a Decision Support System (DSS) that enable water supply companies and river basin water management authorities to timely formulate the most adequate intervention measures and to communicate the pertinent information to the general public [Quinn, 2010].
The decisional process is typically iterative, ideally with a progression between iterations. This is labeled by [GWP, 2009] as the spiral management model. For this purpose, a needed provision for the decision system is to allow changes that lead to improved decision-making in a continuous manner. This objective can be easily accomplished by using computer-based decision platforms that can efficiently assure the cyclical rebound in earlier stages of the decision process [Muste, 2013]. A simplified view of the activity phases embedded in a DSS block diagram is shown in Figure 13. After the identification of the processes that require short-term and long-term interventions, all the alternative remediation actions have to be analysed based on specific optimization criteria, and ranked according to a set of criteria. After implementing the immediate mitigation actions, evaluation of the result has to be critically assessed to infer the favorable/detrimental changes in the initial situation.
Figure 13. Specific elements of the customized DSS for accidental pollutant mitigation.
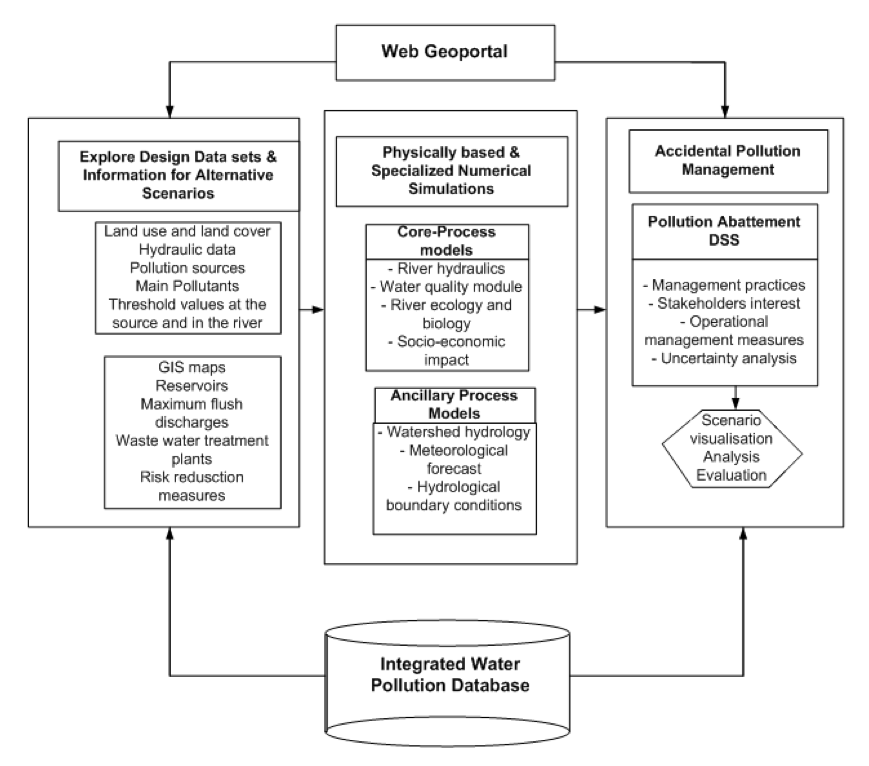
Case study: IoWaDSS Technological Framework
The skeleton of the IoWaDSS architecture is an ontological framework, which initially comprises hydrologic concepts and their relationships with elements of computer science and GIS. This ontology is needed, as the DSS has to handle information that is not in a structured form from computational perspectives. The ontological framework reduces the system complexity and maintenance, while increasing platform flexibility and interoperability. The creation of the ontological framework includes the identification and organization of the functional and domain requirements, and the user scenarios tailored to users’ needs and characteristics. For this purpose, background interviews and questionnaires on the local watershed community members have been conducted, assembled, and converted in information and workflow elements. The garnered information was embedded in the system components functionality and the flux of information between the workflows.
For the DSS domain purposes, the ontological framework is focused on watershed management; therefore a watershed-centered ontology is the basis of system architecture (Figure 14). The ontology associates natural resources (e.g. data, real-time models, simulation results) and user scenarios (e.g. planning process, management workflows) with the hydrologic units (e.g. watersheds, rivers, hydrologic regions) they pertain to. Depending on the watershed-based organization, resources and user scenarios can be integrated into the river connectivity network. Such structures enable users to access hydrologic resources in the context of watersheds and spatial location. The generic flux for the DSS contains:
- (i) a watershed search system to identify the upstream watersheds and their basin identifiers (e.g. GNIS ID, HUC numbers) based on the user’s Point Of Interest (POI),
- (ii) a semantic search system that queries specific decision-related resources, such as real-time sensors, modelling results, land-cover, and soil data within the traced upstream area from the watershed search engine,
- (iii) user interfaces for interacting with the system (e.g. basemaps, user interface) for specific decision support processes,
- (iv) DSS outcomes that contain the post-processed DSS information generated through the planning process. This information is associated with the decision support workflows (e.g. through the planning process and forecasts).
Figure 14. The IoWaDSS Ontological Framework.
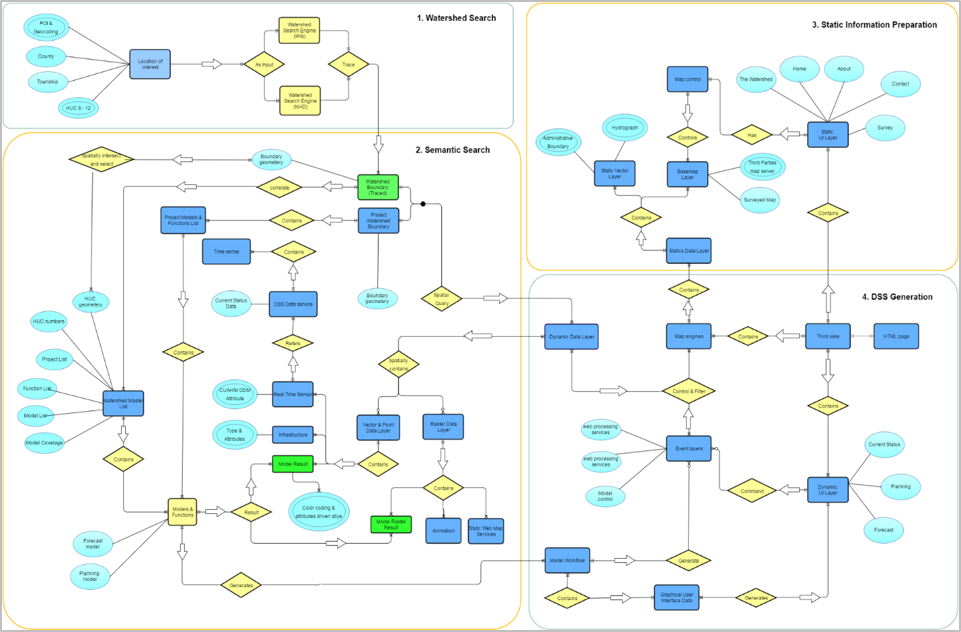
The IoWaDSS platform is currently in development along with its beneficiaries: watershed management authorities [IDNR] that have been formed in many of the Iowa watersheds to take ownership of the water problems at the community level. DSS such as IoWaDSS provides numerous benefits to local and regional stakeholders by allowing users at multiple scales to engage in a meaningful dialogue across jurisdictions. The platform connects top-level agencies and expertise with community-level non-technical groups in their common effort to enhance and monitor the health of the watersheds. Regulators, planners and the communities explore collaboratively the impacts of land use and climate changes on watershed hydrologic response and evaluate the inherent social, environmental and economic trade-offs that occur. The centralized data repository and modelling platform developed through this study allows stakeholders from the Federal to the local level to rapidly compile the existing conditions, develop, compare and evaluate alternative scenarios within an integrated water resources management approach. Visualization of the scenario results web-based interactive maps and query interfaces for communication with stakeholders make the decision process sustainable and manageable. It can be concluded that the DSS can become a powerful tool for helping users across all levels and organizations by supporting their decision-making and communication efforts towards their common goals of sustainable and resilient watersheds.
Accidental water pollution
The occurence of an accidental water pollution can have dramatic consequences such as threatening the life of people that use the water for domestic purposes, or compromising dependent economic activities (e.g., agriculture, fishing).
The reduction of the concentration of pollutant on any river after an accidental pollution happens can be realized using dilution and introducing an additional amount of clean water released from the dams placed on the river’s tributaries.
Paper [Ciolofan, 2018] presents a solution to cope with water pollution. Firstly, a hydraulic simulation and the pollutant transport have been realized by using proffesional software packages (MIKE11) for two scenarios: no dilution and dilution (bottom gates of the dams open). A database was created, containing the results of simulations of pollutant transport for various values of the pollution parameters in both diluted/undiluted scenarios. Based on this data, a web decision support tool that presents a modern intuitive and easy to use GUI was implemented. The end-user are presented straightforward actions to be taken (e.g., "Open the bottom gates of the reservoir X at time T1 and close them at time T2). Additionaly, synchronized charts depicts the effects of the dilution in respect to the concentration of pollutant at certain locations along the river. The authors proposed an heuristic method for dilution and showed that using the proposed approach a reduction of pollutant concentration in the river with up to 90% can be obtained.
4.12 Anomaly detection on smart sensors data used in water management
As IoT and Big Data processing technologies have experienced a rapid development, large sets of sensor data are gathered every day. These sets of captured data usually contain very useful and sometimes critical information, that is used in numerous services. For example, in hydroinformatics, the data provided by an IoT network can be used in flood management – e.g. a warning system for rising water levels. However, we must consider that, due to a mixture of reasons, sometime the sensor data has some anomaly. Thus, anomaly detection became a common problem in our days.
Anomaly detection is done using different machine learning algorithms or different heuristics rules. From the perspective of learning model there are three main categories techniques used for anomaly detection: unsupervised, supervised and semi-supervised anomaly detection. From the perspective in which detectors can differentiate abnormal from normal data [Sinwar, 2015] classified outliers’ detectors in four categories:
Statistical Distribution – Based Outlier detectors. This model assumes that data is distributed according with a probability model. A discordancy test is done for testing if an item is or not abnormal
Distance – based Outlier detectors. The distance-based methods are most preferred since human eyes can detect them easily
Density – based Outlier detectors. This approach is similar with distance based, the main difference is that the anomaly is detected in the local neighborhood. We may think about local neighborhood as the area nearest to the cluster boundary. Some clusters have a high density, while some are less dense. In the density-based method an object is considered outlier if it is in the neighborhood of a cluster whose density is very high. It might not be an outlier if the cluster is less dense.
Deviation – based Outlier detectors. These methods do not use the statistical tests or any distance-based metrics to identify outliers, instead they identify outliers based on their characteristics. The objects whose characteristics are different from the group are treated as outliers.
Also, depending on data characteristics there can be different approaches for detecting outliers: stationary data or non-stationary data. Data characteristics play a key role in defining the overall architecture. In the case of IoT systems, usually we are dealing with big streams of data, which sometimes need to be processed in real time.
In the following sections the main classes of anomaly detection techniques are briefly described.
Unsupervised anomaly detection. In this case, it is assumed that the majority records from the dataset is normal. Based on some metrics, rules or algorithms some items are distinguishable from the common data, so are considered abnormal (outliers). The labeling can rely on probabilities distributions or distance metrics. The accuracy is strongly dependent on dataset dimension and, on how balanced the data is. The big advantage of these techniques is that they are simple, easy to understand and usually very efficient.
Heuristic/rule-based anomaly detection (see Fig. 15). This was the earliest anomaly detector. It was widely spread in the past because of its simplicity and efficiency. Together with the Subject Matter Expert, a set of rules which differentiate the normal behavior from the abnormal are established. The rules are then applied by a calculation device called anomaly detector. Such detectors are applied when the data complexity is not to high, when is easy to extract rules.
Figure 15. Heuristic/rule-based anomaly detection.
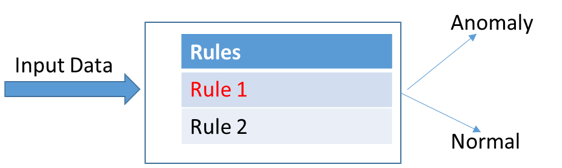
Clustering based anomaly detection. The idea behind this approach is to group the existing data into separate groups, called clusters. Once clustering is done, testing if a new instance is abnormal or not is equivalent with checking if the instance is part of a cluster or not. If it is too far for any of cluster it is considered abnormal otherwise is normal. Of course, for doing that, a representative number of instances is required. The data on which the clustering is done should be unbalanced.
The most common clustering algorithms used for anomaly detection are the following:
K-means algorithm. A number of K centroids are build based on a distance metric. The clusters have equal radius.
Expectation Maximization. Based on given d number and a probability distribution, d clusters are computed. The main difference between K-means is the fact that clusters didn’t have equal radius
K-NN. The label of a particular instance is given by the majority of the first k neighbors. If the label deduced using the algorithm is different from the real one is considered outlier otherwise is considered normal. The drawback of K-NN is the fact that requires that all the data should be always available in order to compute first K neighbors.
Such techniques are used especially in financial market, in political and social polls, in healthcare [Christya, 2015], but there are not optimized in determining the anomalies from sensor data. For this specific type of data, new adaptive, hybrid solutions were proposed. Such an example is Strider [Ren, 2017] that uses a mix of static (heuristic-based) and dynamic (cost-based) optimization approaches. Strider is an adaptive, inference-enabled distributed RDF stream processing engine that can be used to automatically detect anomalies in sensor data, i.e. observational data that is streaming in from sensors installed in a river, lake or an urban water system. This engine was introduced in the context of a water related project from France ([Waves FUI]), where it is used in processing data streams from sensors distributed over a potable water distribution network.
Supervised anomaly detection. The main difference between the unsupervised and the supervised techniques is the fact that data is previously labeled. Initially, data is labeled in two categories normal and abnormal. In the second phase a classifier is trained based on existing data. There are multiple classifiers used in practice: decision trees, support vector machines, ensemble learning, neural nets (deep learning). Any supervised learning algorithm has three phases: training, validation and testing. The accuracy is strongly dependent on dataset dimension and on how well the data is labelled. Usually, in practice analyzing and labelling the data is the most difficult phase. The labeling is done by the Subject Matter Expert. The big advantage of supervised anomaly detection is the fact that is considered being adaptive, it doesn’t require human intervention.
Anomaly detection based on logistic regression. Using logistic regression data is split in two categories normal and abnormal. The most widely used classifier is the logistic regression. The main condition for applying this technique is that data needs to be linearly separable. When is not satisfied, a way to fix it, is to derive new features from the existing one such that it becomes linearly separable.
Anomaly detection using support vector machines (SVM). Support vector machine is a very efficient machine learning algorithm. Compared with linear regression because it is an important step forward. Using different Kernels, it overcomes the linearly separable space condition. The idea behind the algorithm is to determine the boundary points, also called support vectors, of the two classes and then linearly separate them. There are several articles related to anomaly detection in the network intrusion field using SVM [Fisher, 2017], [Poomathy, 2017].
Decision Trees based anomaly detectors. Decision tree classification were widely used in practice because they are easy to understand and very intuitive. Based on the training set one or more decision trees are generated. The leaves represent the labels and the upper nodes have specific attribute conditions. The final classification is done by traversing the tree from the root to the leave. In the case of an anomaly detector the leaves have two values normal or abnormal. Algorithms like ID3, C4.5 developed by Quinlan were used in the past.
Now as the power of ensemble learning was discovered different decision trees-based algorithms appeared. Such techniques are now the best classifiers. Ensemble learning algorithms like Ada-Boost, XGBoost, Random Forest are implemented based on decision trees. They are winning almost all Kaggle competitions. In the training phase these algorithms require strong computation power. In Big-Data systems Random Forest is preferred because the training can be computed in parallel.
Of course, as long as they are very good classifiers they perform very well also as outlier detectors. Such detectors are very robust. The main problem with ensemble trees is the semantic gap. In a random forest or XGBoost algorithm the model resulted from training can contain hundreds of trees. The decisions made by the trained model are completely opaque from the human perspective.
Deep Learning - anomaly detectors. Deep learning is an edge case of ensemble learning. We can state that each neuron in a neural network is a weak learner. The efficiency of the algorithm is strongly dependent on the number of neurons. In the past because of the lack of computation power the implementation of neural nets with large numbers of neurons was physically impossible.
Any neural net is structured in different layers. Each layer has several neurons. The training phase is done using the backpropagation algorithm (back-propagating the gradient from the top layer to the bottom). Given a cost function we would like to determine the neurons weights which minimizes it. There are function optimizations procedures like Gradient-Descent, Adam, Ada-Grad, Nesterov, RMSProp [Ruder, 2017].
Since GPU’s development, starting with 2008, neural net classification become more and more attractive. Now in this area are written probably the most computer science articles. What in the past seemed to be impossible to classify, now is possible. Neural nets, using convolutional layers are used for edge detections (a case of outlier detection) with the same accuracy as human being. Also, IBM developed neural nets for detecting fraud detection. RNN architectures are also used for anomaly detections in time-series.
There are several deep learning frameworks available which supports learning on both CPU and GPU: TensorFlow [Géron, 2017], Caffe [Shelhamer, 2017], CNTK [Salvaris, 2018].
Semi-supervised anomaly detection. These techniques initially build a model which characterize normal behavior. Using this model other possible instances can be generated. To label a new item as being normal or abnormal is equivalent with checking the likelihood of that particular item to be generated by the model. If the likelihood is very small (is smaller than a threshold) it is considered abnormal otherwise is considered normal. These techniques were not commonly used in practice. They are strongly dependent on the pre-build model. This method is applied when there are not enough outliers available.
Outlier detection in time-series. All the above methods apply mainly to stationary data. By stationary data we mean data which doesn’t have local or global trends. For non-stationary data there are basically three main strategies:
Convert non-stationary data to stationary data. Once data becomes stationary we can use any of the methods presented above;
Create an outlier predictor based on transitory analysis done on a fixed window size;
Create a model able to predict the data. By comparing the prediction with the real outcome, we can decide if there is an outlier or not.
A. Converting non-stationary data to stationary. This step tends to be critical for many timeseries algorithm. Understanding the level of non-stationary gives you a strong insight of the data. There are two concepts: trend and seasonality. Trends are assimilated with the moving average. If the mean varies over time on a particular direction, then we have a trend. Similarly, if the data variation happens on a frequent window interval then we have a seasonality. We say that data is stationary when we have a constant mean, a constant variance and the autocovariance matrix does not depend on time.
B. Transitory analysis. For the transitory part a common approach is to use frequency analysis [Akyildiz, 2014].High activities on high frequency bands are quite unusual, even more when we are talking about physical parameters like temperature, pressure, etc. That’s why several outlier detectors are based on that. The problem is how to establish which behavior is normal and which is not. Usually this is based on specific thresholds. These thresholds can be computed analytically. To do so, first we apply a windowing transformation to our data.
Figure 16. Outliers Detector Scheme.
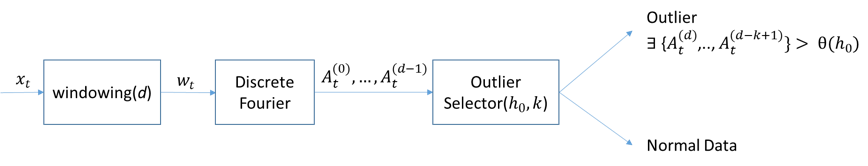
In fig. 16 it is presented the entire scheme of an Outliers Detector based on frequency analysis. The advantages of such detector are speed and clarity. It can be easily applied to big data streams and works in real time. On the other hand, is not so precise.
C. Timeseries predictions.Computing a model which predicts the timeseries is another way of detecting outliers. Having such a model we define an outlier detection algorithm based on comparing the observation with the predicted value.
Figure 17. Timeseries prediction Scheme.
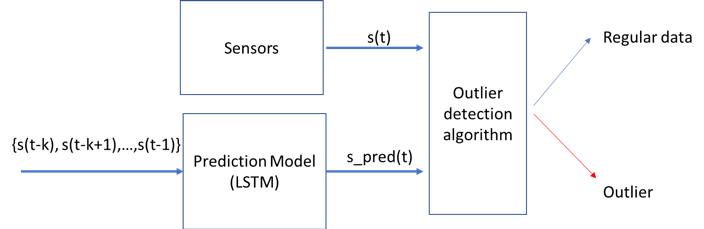
Anomaly detector performance evaluation. There are many algorithms for anomaly detections, which perform good or bad depending on situation. The performance evaluation of an outlier detector is done based on several indicators and attributes used:
Precision, Recall, F-score. Number of false positives is also a critical indicator. Any anomaly detector should minimize this number. For example, an alert system that is feed with sensor data (an example of Outlier detection), having a big number of false positives is equivalent with unnecessary warnings or alerts which can destabilize the system functionality. This situation in real life is unacceptable.
Tunabilitycharacterize how our detector can support fine tuning to accommodate with different scenarios
Adaptiveis a property which characterizes detectors who can automatically adapt to data. For example, we would like our detector to take into consideration data seasonability and locality
Simplicity. A high complexity detector usually implies high cost for both implementation and administration. There are situations when infrastructure required for putting in practice a specific detector is too big and expensive and doesn’t have business justification.
Closing the semantic gap. In our days, there are many detectors based on ensemble learning or deep learning. Even if they are smarter than other sometime is very difficult to understand why they labeled a record as being abnormal. We would like to have hints which can explain to us how the decision was made
Speed. In many real scenarios the speed in which the detection is done is very important, especially when using sensitive hydrological data. This can make detector practical or unpractical. There are situations in which the anomaly detector should work in real-time. For example, in hydrology, if the system detects anomalies that could translate in flood, hurricanes or other natural disasters.
Distributed Systems for Outliers detection. In recent years several distributed systems were proposed for detecting outliers. Using Randomized Matrix Sketching method an outlier detector was designed on top of Apache Spark leveraging Apache Spark Streaming [Psarakis, 2017]. Based on K-means algorithm an outlier detector was designed on top of Apache Hadoop [Souzaa, 2015]. A distributed solution which use Local Outlier Factor (LOF) [Yan, 2017]. Twitter proposed a novel statistical learning algorithm for detecting outliers in timeseries. The method called Seasonal Hybrid ESD was applied in cloud on big streams of data [Hochenbaum, 2015]. RAD system used by Netflix. The algorithm is based on PCA. PCA uses the Singular Value Decomposition (SVD) to find low rank representations of the data. The robust version of PCA (RPCA) identifies a low rank representation, random noise, and a set of outliers by repeatedly calculating the SVD and applying “thresholds” to the singular values and error for each iteration.
The best outlier detector known today are using deep learning. Looking from this perspective the systems used/proposed were designed mainly to scale to huge loads of data, the focus not being on outliers’ detection quality.
An optimized solution for anomalies detection in time series data via deep learning algorithm is presented in [Kanarachos,2017]. This solution combines wavelets, neural networks, and Hilbert transform, in order to have long-term pattern interdependencies, that is usually a hard task to accomplish using standard neural network training algorithms. By comparison with the majority of the existing anomalies detection algorithms, their solution [Kanarachos,2017] targets the accurate and early detection of the anomalies, and not in the usual classification or determining the anomalies origin; and most importantly their solution does not require prior anomalies in the data. This aspect is very important when considering real life hydrological data, where anomalies are very rare, or data is too expensive to collect.
4.13 Machine-to-Machine Model for Water Resource Sharing in Smart Cities
Taking into consideration the possibilities offered by the ICT technologies and the critical problems in water management field, a model of M2M device collaboration is proposed. The main purpose is optimization of water resource sharing. This model represents a M2M integration between RoboMQ (messsage broker) and Temboo (IoT software toolkit) to coordinate the distribution of the same available water resource when several requests are made at the same time. We use the following methods:
Use labeled queues to differentiate between messages (data values), therefore evaluating the greater need before sending the commands to the actuators;
Tune prameters for obtaining a generic water saving mode which the user can set when receiving several notification alerts of water shortage (expand for usage on large scale-e.g. city scale) Targeted at/ Use Cases;
Regular end-users for better management of household or small facilities water resources farms, rural houses, residences with their own water supply, zoo/botanic gardens;
Authorities for better management of single city water resources in critical situations prolonged water shortage, prolonged repairs to the water infrastructure, natural disasters.
Figure 20. Machine-to-Machine Model for Water Resource Sharing in Smart Cities. Proposed architecture.
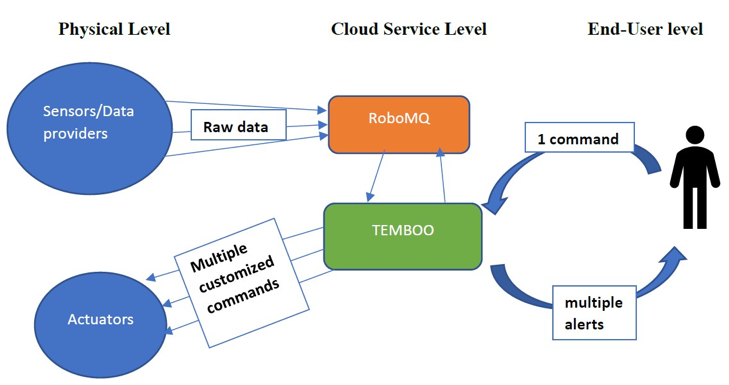
The architecture of the proposed model in presented in Fig. 20. The architecture is structured on three levels: Physical level, Cloud Service level and EndUser level. At Physical level exist sensors that transmit raw data to a RoboMq service, and actuators that receive multiple customized commands form a TEMBOO service. Al Cloud Service level exist two systems ROBOMQ that receive data from sensors and TEMBO that send commands at physical level. The top level in End-User level that take as input commands form users and receive multiple alert form physical and cloud service level.
In order to be able to build a solution for the M2M model proposed, the elements needed in the integrations have to be identified. The intention is to integrate two different entities, one being a system of sensors and actuators and the other one a mobile/desktop application that offers the possibility of receiving a notification/message alert but also of giving back a response. The communication between the two systems, or better said, between the system and the end-user can be done through a Message Oriented Middleware (MoM), while the flows of action can be implemented into microservices (e.g email alert microservice).
RabbitMQ has been chosen as a MoM for a performance analysis in order to confirm if this type of middleware is suitable for the model proposed.
RabbitMQ is a message-queueing software usually known as a message broker or as a queue manager. It allows the user to define queues to which applications may connect and transfer messages, along with the other various parameters involved.
A message broker like RabbitMQ can act as a middleman for a series of services (e.g. web application in order to reduce loads and delivery times). Therefore, tasks which would normally take a long time to process can be delegated to a third party whose only job is to perform them. Message queueing allows web servers to respond to requests in a quick way, instead of being forced to perform resource-heavy procedures on the spot. Message queueing can be considered a good alternative for distributing a message to multiple recipients, for consumption or for balancing loads between workers.
The basic architecture of a message queue is based on several elements: client applications called producers that create messages and deliver them to the broker (the message queue), other applications called consumers that connect to the queue and subscribe to the messages. Messages placed in the queue are stored until the consumer retrieves them.
Any message can include any kind of information. It could have information about a process that should start on another application (e.g. log message) or it could be just a simple text message. The receiving application processes the message in an appropriate manner after retrieving it from the queue. Messages are not published directly to a queue, but, the producer sends messages to an exchange which is responsible for the routing of the message to different queues. The exchange routes the messages to message queues with the help of bindings (link) and routing keys [RabbitMQ Website documentation, 2018].
The message flow in RabbitMQ contains the following elements (Fig. 21):
Producer: Application that sends the messages.
Consumer: Application that receives the messages.
Queue: Buffer that stores messages.
Message: Information that is sent from the producer to a consumer through RabbitMQ.
Connection: A connection is a TCP connection between your application and the
RabbitMQ broker.
Channel: A channel is a virtual connection inside a connection. When you are publishing or consuming messages from a queue it's all done over a channel.
Exchange: Receives messages from producers and pushes them to queues depending on rules defined by the exchange type. In order to receive messages, a queue needs to be bound to at least one exchange.
Binding: A binding is a link between a queue and an exchange.
Routing key: The routing key is a key that the exchange looks at to decide how to route the message to queues. The routing key is like an address for the message.
AMQP: AMQP (Advanced Message Queuing Protocol) is the protocol used by RabbitMQ for messaging.
Users: It is possible to connect to RabbitMQ with a given username and password. Every user can be assigned permissions such as rights to read, write and configure privileges within the instance. Users can also be assigned permissions to specific virtual hosts.
Vhost, virtual host: A Virtual host provides a way to segregate applications using the same RabbitMQ instance. Different users can have different access privileges to different vhost and queues and exchanges can be created so they only exist in one vhost.” [RabbitMQ Website documentation, 2018].
Figure 21. RabbitMQ architecture.
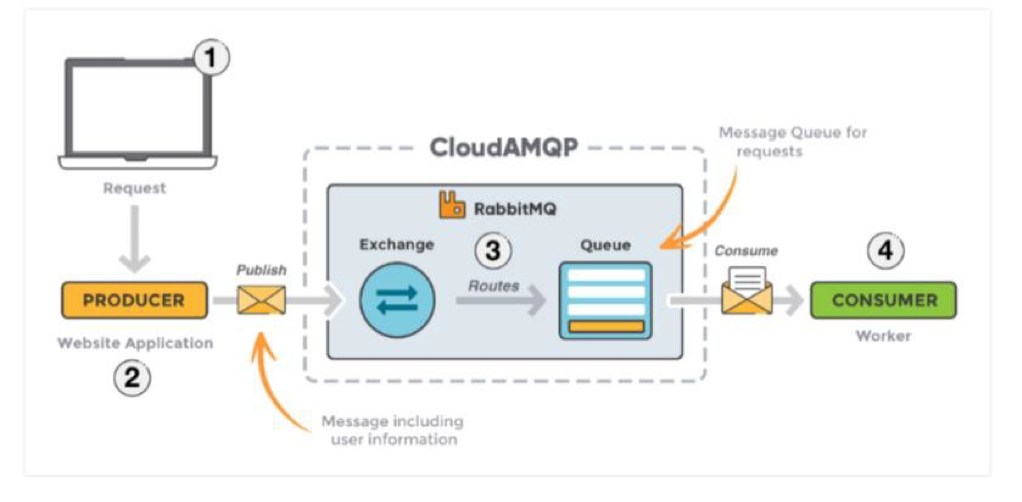
Test Performance on RabbitMQ. The aim of this test is to assess/analyze the performance of RabbitMQ server under certain imposed conditions. In order to run the tests a CloudAMQP instance hosting RabbitMQ solution will be used. RabbitMQ provides a web UI for management and monitoring of RabbitMQ server. The RabbitMQ management interface is enabled by default in CloudAMQP.
Steps performed for setting up CloudAMQP:
1) Create AMQP instance (generates user, password, URL). A TCP connection will be set up between the application and RabbitMQ
2) Download client library for the programming language intended to be used (Python): Pika Library
3) Modify Python scripts (producer.py, consumer.py) to:
open a channel to send and receive messages
declare/create a queue
in consumer, setup exchanges and bind a queue to an exchange, consume messages from a queue
in producer, send messages to an exchange, close the channel. The scripts are attached in Annex.
Parameters monitored: Queue load, publish message rate, Delivery message rate, Acknowledge message rate, Execution time, Lost messages, Memory usage as can been seen in Fig. 22.
Figure 22. RabbitMQ test scenarios.
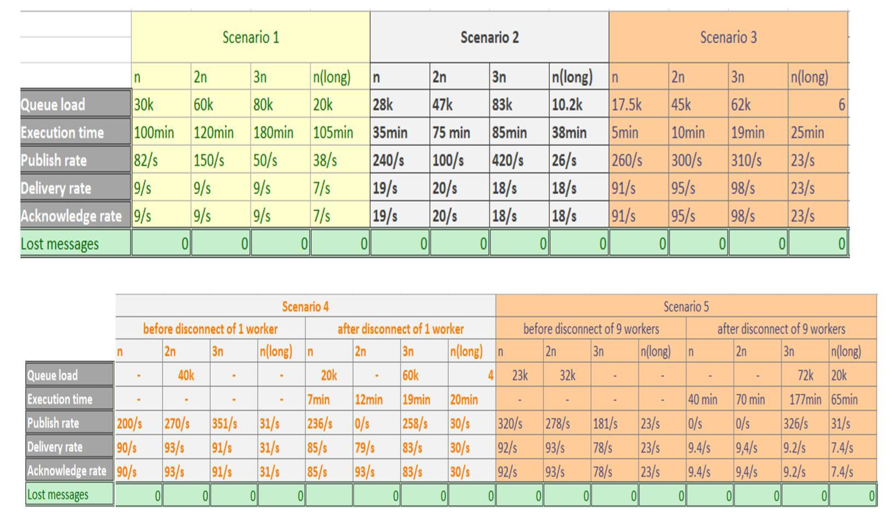
Observations based on results. When having only one consumer, the Queue load value increases proportionally with the number of messages sent (n-30k -> 2n-60k -> 3n-80k). Queue load is reduced with approximately 15% when increasing the number of consumers from 1 to 10. Execution time is reduced with approximately 70% when doubling the number of consumers. Publish rate is directly influenced by the size of the message being sent but is independent from delivery rate. Queue load is directly influenced by the delivery rate. Delivery rate is increased proportionally with the number of consumers, when sending a short message (1 consumer-9/s -> 2 consumers-18/s -> 10 consumers-91/s). When sending long messages and having multiple consumers, publish rate and delivery rate have close values, hence queue load is very small. The time needed for the message to be published is almost the same with the time needed for the message to be sent and acknowledged. When sending long messages and having one consumer, the same theory as in the short message case is applied, queue load is remarkably increased (6 to 20k) and delivery rate is lowered to a value smaller than the rate per user receiving short messages (30/s to 7/s). When killing one or multiple consumers in the the send/receive process, the messages are redirected to the other running consumers. No other messages are lost, except for the ones that were already acknowledged by the consumer which was disconnected. Messages are not equally distributed to multiple consumers, but the values are similar enough (e.g for 10 workers: 3030, 3005, 3014, 2966, 2998, 2995, 3023, 2978, 2988, 3002). When having a send/receive process without acknowledgement, queue load is 0, as the messages are continuously sent, without waiting for a response from the consumer. This approach is risky, as the user has no information about possible lost messages.
Valuable features: RabbitMQ offers an efficient solution for message queuing, easy to configure and integrate in more complex systems/workflows. It can withstand and successfully pass stress load bigger than 10k calls and it decouples front-end from back-end.
Room for improvement: The most common disadvantage is related to troubleshooting, as users have no access to the actual routing data process. A graphical interface or access to inner parameters would be useful when dealing with large clusters.
Microservices. The term "Microservice Architecture" describes a particular way of designing software applications as series of independently deployable services. This new software architectural style is an approach to developing a single-bulk application as a suite of small services, each of which are running its own process and communicating with lightweight mechanisms (most commonly HTTP resource API, since REST-Representational State Transferproves to be a useful integration method, as its complexity is lower in comparison with other protocols.[Huston, 2018]) These services are built around business capabilities and are can be deployed independently by fully automated deployment machines [Fowler, 2018].
Basically, the each microservice is self-contained and includes a whole application flow (database, data access layer, business logic) while the User Interface is the same.
One of the most important advantages of microservices is that they are designed in order to cope with failure. They are an evolutionary model, which can accommodate service interruptions. If one micro-service fails, the other ones will be still running. [Huston, 2018] Also, when there is need for a change in a certain part/functionality of the only the microservice in cause will be modified and redeployed. There is no need to change and then redeploy the entire application.
If a functionality needs to be cloned on different nodes, only the specified microservices will be cloned, and not the entire action flow of the application. This offers better scalability and better resource management.
Although microservices are supposed to be as self-sufficient as possible, a large number of microservices can lead to barriers in obtaining information/results if this specific information has to travel through. Mechanisms of monitoring and management of the microservices have to exist or to be developed in order to orchestrate and maintain the efficiency level higher than the effort/fault level.
Middleware service platforms which offer microservice integration have tools for managing and monitoring microservices and well as for building their flow and the communication between them. With the help of IoT integration, these are able to further communicate with data gathering sensor systems or to send command messages to actuators from active systems. Such platforms are IBM Cloud, RoboMQ or Temboo which provide solutions that will be discussed below in this paper.
IBM Cloud solutions –offers a complete integration platform with all resources for creating, monitoring and manipulating a Web Service, Microservices or IoT connections. Relevant elements are detailed below. So-called Functions (see Fig. 23) allow connectivity and data collection between physical sensor systems, cloud database and end-user. The functions communicate through messages (MoM middleware).
Figure 23. IBM Cloud Functions.

Event providers (see Fig. 24), from which Message Hub, Mobile Push and Periodic Alarm are needed.
Figure 24. IBM Cloud Event Providers.

Languages supported (see Fig. 25), from which implementation choice: Python.
Figure 25. IBM Cloud languages.
IoT simulator enables testing the whole flow with randomly generated or chosen values for the simulated sensors. This offers the chance of separating the work of sensor connectivity from the work on the actual action flow and also leaves a lot of space for optimizations and use case testing.
RoboMQ solutions offers an integration platform with easy-deployable microservices and RabbitMQ message-oriented middleware. Relevant elements are: AMQP with Request-Reply (see Fig. 26), Integration flow designer (see Fig. 27), Data Driven Alerts (see Fig. 28) – offers real time alerts to user depending on data obtained from devices and analyzed through machine learning rules/algorithms, a device simulator – offers the possibility of implementing and testing the workflow without actually connecting the physical system to the cloud. Similar to the IBM simulator, it offers value generation for specific parameters and a time setting which would resemble the real sensor system.
Figure 26. AMQP with Request-Reply.
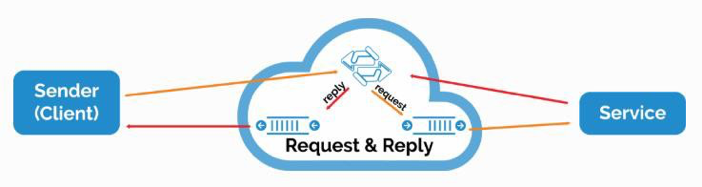
Figure 27. Integration flow designer.
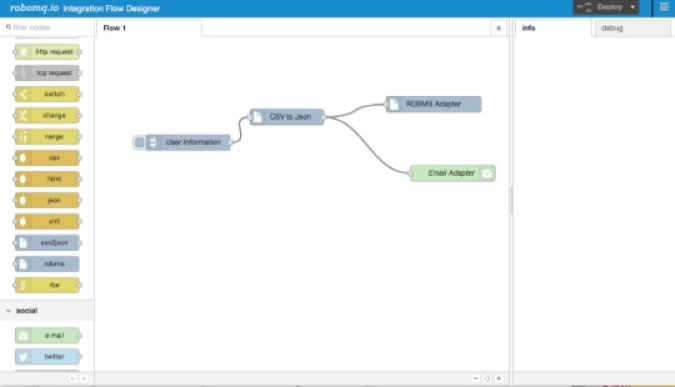
Figure 28. Data Driven Alerts.
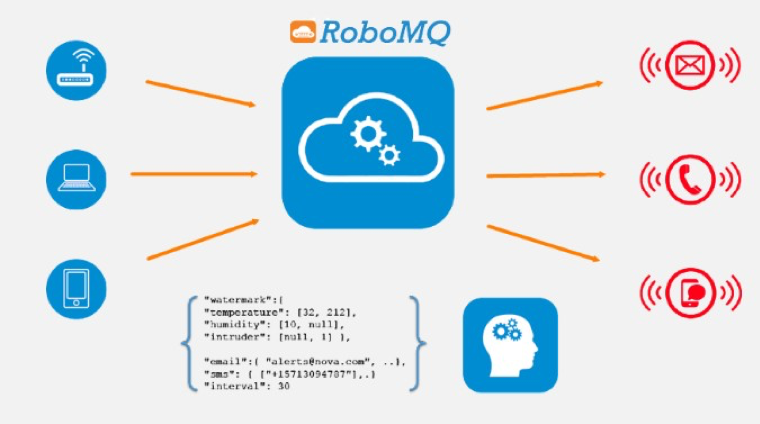
4.14 Reinforcement Learning for Water Management
Scarcity of water and the increasing awareness of the need to save energy in providing good quality water to increasing numbers are driving the search for new ways to save water as well as energy and improve the financials of water utilities. At the same time the increasing “digitalization” of urban Water Distribution Networks (WDNs) is gen-erating huge amounts of data from flow/pressure sensors and smart metering of household consumption and enabling new ways to achieve more efficient operations. Sequential decision models are offering an optimization framework more suitable to capture the value hidden in real time data assets. More recently, a sequential optimisation method based on Approximate Dynamic Programming (ADP) has been pro-posed, whose preliminary computational results demonstrate that this methodology can reduce the electricity expenses while keeping the water pressure in a controlled range and, at the same time, is able to effectively deal with the uncertainty on the water demand.The full material describing the reinforcement learning models for water management can be found here.
5 Participatory / citizen science for water management
Worldwide, decision-makers and non-government organizations are increasing their use of citizen volunteers to enhance their ability to monitor and manage natural resources, to conserve protected areas for example.
Citizen science (or, community science) is the process whereby simple citizens are involved in what is known as “science as researchers” [Kruger, 2000]: it is more than “scientists using citizens as data collectors”, but rather “citizens acting as scientists”. It offers important tools designed to facilitate the monitoring of common community [environmental] concern by simple citizens, government agencies, industry, academia, community groups, and local institutions, working together [Kruger, 2000]. Such community-based monitoring (CBM) initiatives include citizens and stakeholders in the management of natural resources and watersheds [Keough, 2006]. This is highly coupled with Integrated Water Resource Management (IWRM), which is regarded as “the process, which promotes the coordinated development and management of water, land and related resources, in order to maximize the resultant economic and social welfare in an equitable manner without compromising the sustainability of vital ecosystems” (www.gwpforum.org). This definition clearly states that water management is an interdisciplinary process, but also more importantly, decisions must involve the participation of members of the community affected by water-related strategies, in other words the stakeholders – that is to say the most affected members of the community, rather than just the most powerful and organized, or only the legally involved parties.
In Europe, participation in water resource planning gained a new institutional stature with the Water Framework Directive (WFD). This calls for the active involvement of all interested parties in the implementation process and particularly in the production, revision, and updating of River Basin Management Plans (Article 14; Council of the European Communities, see [EC, 2000]). Planning methods that combine public participation with decision-making functions are therefore increasingly in demand [EC, 2002].
Citizen contributions can be successfully integrated in the field of water management. There are certain situations when it is difficult to collect accurate data, either due to a lack of sensors, or other data sources [Thaine, 2018]. In these situations it is possible to improve the processes of monitoring and modelling through the use of citizen data, collected either directly or through social networks.
Such methods can be integrated at different levels in a project. At the simplest level citizens can be used only as sensors to collect data, while a more complex integration of citizen science is in the definition of the problem. At the next level of integration, citizens can also be involved in data analysis. This is the most complex participatory science level, where the volunteers are involved in the entire processing chain, for problem definition, data collection and analysis.
For example, in the field of water management, such techniques can be used to determine water levels where there are no other data collection methods. In [Lowry, 2013] volunteers would send water gauge readings through text messages.
Text messages were also collected to determine water levels by the authors of [Walker, 2016]. The same goal of determining water levels was also in [Starkey, 2017], but the collected data was also augmented with pictures and media collected from social media. Beside water levels, crowdsourcing can be also used for flood modelling. In this case, it is possible to determine different variables, such as: water level, velocity, land cover, topography [Thaine, 2018].
Beside the usual social media information sources, Youtube can also be used to determine water levels. The authors of [Michelsen, 2016] estimated water levels taken from images of the same area from youtube videos. The estimated values were accurate due to known elements in the area, such as walls with graffiti, while the time of the measurement was either the upload date of the video or the time reported by the uploaders, if it was present.
An interesting topic of the community science is coupling several data sources, at pan-European scale, from participatory actors. The design of effective indicators at a continental scale requires both conceptual and spatial aggregation (see Section 5.1).
Participatory research through partnerships between scientists and citizens provides an approach to natural resources management, which recognizes the complexity of issues with collecting enough data (see Section 5.2).
For data collection in particular, more recently people turned their attention towards participatory sensing. Unlike the traditional questionnaire-based collection processes, participatory sensing relies on electronic means widely available for collecting the data with the help of people (see Section 5.3).
For encouraging participation, various reputation models have been proposed and used for participatory sensing (see Section 5.4).
A problem that arises from the crowd-sensing applications is maintaining the integrity of sensor data collected (see Section 5.5).
5.1 Coupling several data sources
An interesting topic is coupling several data sources, at pan-European scale, from different stakeholders and policy makers (participatory actors in the framework). The design of effective indicators at a continental scale requires both conceptual and spatial aggregation [Niemeijer, 2002]. Specific and local management interventions may require a larger set of detailed indicators to be developed at a higher resolution - the European statistical system (ESS), consisting of Eurostat and the appropriate bodies in member state administrations, ensures that the statistical needs of policy-makers are met. Data are geo-referenced and managed by Eurostat with the geographic information system of the European Commission (GISCO) [Eurostat, 2001]. GISCO geo-referenced databases contain topographic and thematic layers at five different scales. Tools have been developed for standardized cartographic production and for advanced spatial analysis.
For example, several hydrography databases exist for the EU water studies that include rivers and lakes coverage. The catchments have been derived from a hierarchical river network, together with climate data provided for over 5k stations in all EU member states, collected by the monitoring agriculture with remote sensing (MARS) project [Vossen, 1995]. The two main climatic variables are precipitation (average, maximum 24 h rainfall, number of rain days, average snowfall, number of snowfall and snow cover days) and temperature (average, maximum, minimum, absolute monthly maximum and minimum, number of frost days). Other climate attributes include, relative humidity, vapour pressure, atmospheric pressure, bright sunshine, evapotranspiration, wind speed and cloud cover.
Many more such community-based monitoring (CBM) initiatives were developed in the last years. The Waterkeeper Alliance, for example, developed programs (e.g., Riverkeeper, Lakekeeper, Baykeeper, and Coastkeeper) for ecosystem and water quality protection and enhancement, with major pilots in USA, Australia, India, Canada and the Russian Federation. The URI Watershed Watch Program produces quality data from over 200 monitoring sites statewide (and citizens are encouraged to participate as active data readers). Produced and processed in certified laboratories, this information is used by the Rhode Island Department of Environmental Management for assessing the State’s waters, as well as by municipal governments, associations, consulting firms and residents for more effective management of local resources. Similarly, Florida’s LAKEWATCH program is one of the largest US lake monitoring programs in the nation with over 1800 trained citizens monitoring 600+ lakes, rivers and coastal sites in more than 40 counties. Volunteers take samples to collection sites located in 38 counties.
CBM relationships with universities have also increased; perhaps due to their capacity to provide training, lab facilities, free space, and funding [Savan, 2003. Some examples of CBM initiatives linked with academic institutions include the Alliance for Aquatic Resource Monitoring (ALLARM), housed within the Environmental Studies Department at Dickinson College in Pennsylvania, or the University of Rhode Island Watershed Watch.
Normally the use of water for productive activities is prohibited in the domestic distribution systems in many parts of the globe, but because these activities sustain in some places the rural poor, users withdraw water for unauthorized productive uses or alternatively water designated for irrigation is used to meet their domestic needs [Van der Hoek, 1995], leading to low availability and low quality of water. The use of “potable” water for all activities has become common, and other sources such as rainwater harvesting or grey-water re-use have been largely ignored in much of Latin America, for example [Restrepo, 2005]. One factor that impedes decision making to improve water services in rural areas is the lack and inconsistency of information on water consumption, availability and quality [Roa, 2008]. Without data, users cannot demonstrate causes of contamination and/or over exploitation of the resource, limiting their ability to lobby local authorities for improvements. Knowing water needs, water availability and the way human activities are affecting the resource, permits a diagnostic of overall watershed conditions, and the determination of priority sites for intervention.
5.2 Participatory research
Participatory research through partnerships between scientists and citizens provides an approach to natural resources management, which recognizes the complexity of issues with collecting enough data. Participatory research has been used, for that, internationally to involve local communities in data collection and monitoring [Roba, 2009][Inmuong, 2005], or natural resources management research [Johnson, 2004]. In [García, 2009], authors explore the involvement of youth in environmental research. The research took place in a small rural watershed in Colombia, the Los Sainos micro-watershed in the western cordillera of the Colombian Andes. The research was conducted in 2004 and 2005, and involved a total of 30 youth, with subgroups involved in specific themes. Youth from 9 to 17 years old were invited to participate in the project through the local schools, and were involved in all aspects of the research including survey design, data collection, analysis and the presentation of results. Working with youth led, particularly interesting, to a raised awareness of environmental issues amongst the youth themselves, and allowed them to raise awareness amongst their peers and adults in the local community. A significant aspect was the development of an approach to watershed assessment, which involved youth in all aspects of the research. This process was found to advance environmental education, and knowledge of research methods and local environmental impacts.
In Romania, in particular, authors in [Teodosiu, 2013] present a case study of how public participation, within the context of Integrated Water Resources Management (IWRM), promoted by promoted by the Global Water Partnership (GWP). IWRM is defined as “The process that promotes the coordinated development and management of water, land and related sources in order to maximize the resultant economic and social welfare in an equitable manner, without compromising the sustainability of vital ecosystems” [GWP, 2000]. The implementation of IWRM requires a participatory approach [Odendaal, 2002]. It means that water management authorities should involve relevant stakeholders, such as representatives of water companies, industry, municipalities, agriculture, services, environmental protection agencies, non-governmental organizations (NGOs), universities and research institutions in planning, decision-making and implementation, instead of adopting a top-down approach [Casteletti, 2007]. The importance of public participation (PP) in water management is also recognized by the European Commission through its Water Framework Directive (WFD, 2000/60/EC), which was the first directive that explicitly asks member states to inform and consult the public. Other directives, for example, on environmental assessments (2001/42/EC) and floods (FD, 2007/60/EC), have introduced similar requirements.
The implementation of these requirements is particularly challenging for new member states of the European Union (EU), many of them being post-communist countries. These countries are characterized by major environmental problems, and although the European requirements have been transposed into national legislation, practical application of PP is still lagging behind [Kremlis, 2005]. The governments of these new EU members rather give priority to the establishment of competitive markets and liberalization, while neglecting the development and empowerment of strong civil society representatives that would play active roles in the implementation of IWRM.
In Romania, besides the huge challenge of complying with the water quality standards of the
WFD, there are serious issues to be addressed within the development of effective public participation. The case studies in [Teodosiu, 2013] show that the role of PP in dealing with these challenges is still limited. The first case shows that the traditional stakeholders, especially the water management authorities, still see PP as a simple formal requirement for the implementation of the WFD. Other stakeholders, especially NGOs and water users, feel the need for better representation and involvement, not only in public information and consultation activities, but also in the decision making processes. In practice, as the case of formal participation in the development of river basin management plans shows, stakeholders are often very passive in reacting on plans. And, when stakeholders are engaged in an early stage of the planning process, as is shown in the case of active stakeholder involvement, authorities are reluctant to use the results.
5.3 Participatory Sensing
For data collection in particular, more recently people turned their attention towards what is called Participatory Sensing [Campbell, 2006]. Unlike the traditional questionnaire-based collection processes, participatory sensing relies on electronic means widely available for collecting the data with the help of ordinary people. As mobile phones have evolved from devices that are just used for voice and text communication, to advanced platforms that are able to capture and transmit a range of data types (image, audio, and location), the adoption of these increasingly capable devices by society has enabled a potentially pervasive sensing paradigm - participatory sensing. A coordinated participatory sensing system engages individuals carrying mobile phones to explore phenomena of interest using in situ data collection [Paulos, 2008]. By enabling people to investigate previously difficult to observe processes with devices they use every day, participatory sensing brings the ideals of traditional community based data collection and citizen science to an online and mobile environment, while offering automation, scalability, and real-time processing and feedback [Cooper, 2007]. In particular, in participatory sensing, individuals explicitly select the sensing modalities (they are in control of their privacy-related data) to use and what data to contribute to larger data collection efforts.
For participatory sensing, usage models can range from public contribution, in which individuals collect data in response to inquiries defined by others, to personal use and reflection, in which individuals log information about themselves and use the results for personal analysis and behaviour change. A common workflow, combining elements common to both these extremes [Estrin, 2010] is presented in Fig. 29.
Figure 29. Common architectural components for participatory-sensing applications, including mobile-device data capture, personal data stream storage, and leveraged data processing.
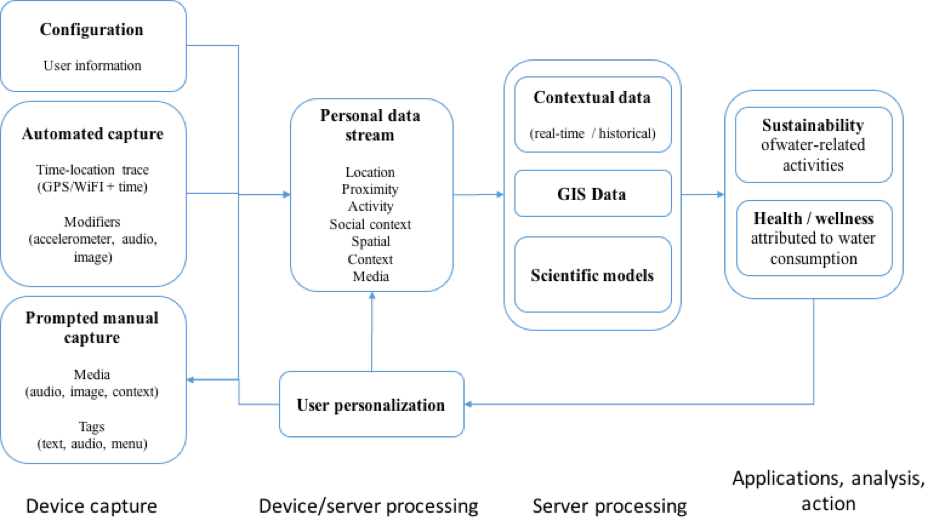
Mobile phones are extremely useful for ubiquitous data capture of everything from image, audio, video, to location data. They are equipped with broadband communication, so data can be sent for further processing to powerful external servers, and are capable to collect valuable contextual information. Because of the sheer ubiquity of mobile phones and associated communication infrastructure, it is possible to include people of all backgrounds nearly everywhere in the world.
The data collected with a mobile device can be further processed through a series of external and cross-user data sources, models, and algorithms, leading to the inferring of complex phenomena about individuals and groups. As many applications use also some sort of comparison of current measures to past trends, in the architecture we also have robust and long-term storage and management of this data.
An example of a participatory sensing project in presented in [Reddy, 2010]. There, authors demonstrate the creation of participatory sensing campaigns using smartphones, along with web services for data storage (Flickr and sensor database), analysis (Python application server), and visualization (Google Maps and Charts). One campaign, called “What's Bloomin”, deals with water conservation, by asking subjects to take geo-tagged photos of “blooming” flora. Having this inventory enables facilities to identify, using the plants, the water saturation within the soil, and draw conclusions as to when to replace high water usage plants with ones that are drought tolerant.
Other environmental / water-related applications include measuring pollution levels in a city, water levels in creeks, and/or monitoring wildlife habitats. Such applications enable the mapping of various large-scale environmental phenomena by involving the common person. An example prototype deployment is CreekWatch, developed by IBM Almaden Research Center [Sunyoung, 2011]. It monitors water levels and quality in creeks by aggregating reports from individuals, such as pictures taken at various locations along the creek or text messages about the amount of trash. Such information can be used by water control boards to track pollution levels in water resources.
There are also several downsides to participatory sensing. Finding a fit between diverse users and participatory sensing projects mirrors traditional selection for volunteer work based on interest and skill. But because participatory sensing is organized virtually / electronically, identifying best-suited particular participants (individuals who collect, analyse, and share their data) for campaigns (targeted data collection efforts) can be, thus far, only partially automated. Identification techniques for participants generally rely not only on participants' reputations as data collectors based contribution habits, but can on participants' availability in the area of interest [Lu, 2010]. Specific attention has to be paid to the fact that humans have self-will, exhibit varied data collection performance, and have mobility traits that are opportunistic in nature [Paxton, 2009].
5.4 Reputation models
For encouraging participation, various reputation models have been proposed and used for participatory sensing. The simplest reputation models are ones that are summation and average based. They use an aggregation of ratings (i.e., by summing, as in case of eBay, or averaging, as in case of Amazon), to create an overall single reputation score [Schlosser, 2004]. An alternative scheme to having reputations being a numerical value is to use discrete labels. For example, the Slashdot web site aggregates ratings on actions, such as story submissions, postings, moderation activities, into tiers for participants that include terrible, bad, neutral, positive, good, and excellent [Reddy, 2010].
Reputation models based on Bayesian frameworks have also been popular for sometimes [Ganeriwal, 2008]. Particularly, such models rely on ratings, either positive or negative, and use probability distributions, such as the Beta distribution, to come up with reputation scores. Reputation is determined using the expectation of the distribution, and the confidence in this reputation score is captured by analyzing the probability that the expectation lies within an acceptable level of error. Additional features are easily enabled, such as aging out old ratings by using a weight factor when updating reputation and dealing with continuous ratings by employing an extension involving the Dirichlet process [Ganeriwal, 2008].
Another challenge for participatory sensing comes from the dynamic conditions of the set of mobile devices and the need for data reuse across different applications. Unlike traditional sensor networks, applications of participatory sensing rely on population of mobile devices, on the type of sensor data each can produce. Data quality in terms of accuracy, latency, and confidence can change all the time due to device mobility, variations in their energy levels and communication channels, and device owners’ preferences. Identifying the right set of devices to produce the desired data and instructing them to sense with proper parameters to ensure the desired quality is a complex problem. In traditional sensor networks, the population and the data they can produce are mostly known a priori; thus, controlling the data quality is much easier. The same sensor data have been used for different purposes in many existing participatory applications. For example, accelerometer readings have found usage in both transportation mode identification, and human activity pattern extraction.
Related to reputation is the need to understand human behaviour, as people are the carrier of the sensing devices, and their recruitment depends on their capability to correctly collect sending data [Mascolo, 2016]. A variety of data mining and statistical tools can be used to distill information from the data collected by mobile phones and calculate summary statistics related to human behaviour recognition. Still, recognizing human behaviour is still a somewhat unsolved research direction, which is why it is generally mention as potential enabler for participatory campaigns, but thus far not many frameworks managed to successfully incorporate this aspect in the recruitment decisions [Lane, 2010].
5.5 Preserving data privacy
An important aspect of such participatory applications is that they potentially collect sensitive sensor data pertaining to individuals. For example, GPS sensor readings can be utilized to infer the location (and sometimes path) of the individual. Such GPS sensor measurements can be shared within a larger community, for the application purpose alone, but at the same time it is necessary to ensure that an individual’s sensor data is not revealed to untrustworthy third parties. A problem that arises from the opt-in nature of crowd-sensing applications is when malicious individuals contribute erroneous sensor data (e.g., falsified GPS readings); hence, maintaining the integrity of sensor data collected is an important problem.
A popular approach to preserving privacy of data is anonymization [Sweeney, 2002], which deals with removing identifying information from the sensor data before sharing it with a third party. The drawback of such an approach is that anonymized GPS (or location) sensor measurements can still be used to infer the frequently visited locations of an individual and derive their personal details. Another approach relies on data perturbation, which adds noise to sensor data before sharing it with the community to preserve the privacy of an individual, is appropriate. Data perturbation approaches [Ganti, 2008] rely on adding noise in such a manner that the privacy of an individual is preserved, but at the same time it is possible to compute the statistics of interest with high accuracy (due to the nature of the noise being added).
Finally, the local analytics running on mobile devices only analyse data on that given device [Ganti, 2011]. Participatory applications rely on analysing the data from a collection of mobile devices, identifying spatio-temporal patterns. The patterns may help users build models and make predictions about the physical or social phenomena being observed. One example is the monitoring of water pollutants - an important aspect of environment protection is to build models to understand the dissemination of pollutants in the air, soil and water. By collecting large amount of data samples about pollutants, using specialized in this case, but still affordable and portable devices, one can not only monitor the concentration of pollution, but also detect patterns to model how the concentration evolves spatially and temporally as temperature, humidity and wind change. These models can help the environmental authority forecast and provide alerts to the public.
6 Secure Smart Water Solutions
A number of related researches works [Osfeld, 2006], [Copeland, 2005], or [Gleick, 2006] provide a threat taxonomy that could target water management systems. According to [Osfeld, 2006], the threats to a water-distribution system can be partitioned into three major groups according to the methods necessary for enhancing their security: (1) a direct attack on the main infrastructure: dams, treatment plants, storage reservoirs, pipelines, etc.; (2) a cyber-attack disabling the functionality of the water utility supervisory control and data acquisition (SCADA) system, taking over control of key components that might result in water outages or insufficiently treated water, or changing or overriding protocol codes, etc.; and (3) a deliberate chemical or biological contaminant injection at one of the system’s nodes. Attacks resulting in physical destruction to water management systems could include disruption of operating or distribution system components, power or telecommunications systems, electronic control systems, and actual damage to reservoirs and pumping stations. A loss of flow and pressure would cause problems for customers and would hinder firefighting efforts. Further, destruction of a large dam could result in catastrophic flooding and loss of life. Bioterrorism or chemical attacks could deliver widespread contamination with small amounts of microbiological agents or toxic chemicals and could endanger the public health of thousands. Cyber-attacks on computer operations can affect an entire infrastructure network, and hacking in water utility systems could result in theft or corruption of information or denial and disruption of service. SCADA systems, a critical part of large industrial facilities, such as water distribution infrastructures, are many times deployed with factory settings, pre-set standard configurations common to entire classes of devices, have no authentication/authorization mechanisms to prevent rogue control and with defence mechanisms virtually absent. With the goal of reducing costs and increasing efficiency, these systems are becoming increasingly interconnected, exposing them to a wide range of network security problems. It is commonly accepted that SCADA systems are poorly resilient against cyber-attacks because by design they were not intended to be exposed to the internet. Therefore, the attack surface has been expanded significantly in cyber area.
Today’s current advanced technology in detection and response is Security Information and Event Management (SIEM) systems. Big data analytics components are also being integrated lately in a way to improve proactive measures and deliver advanced prevention. Even if those technologies are the state of the art in cyber security they still fail to satisfy end users especially if the enterprise environment is complicated. SCADA as such would suffer from similar false positives which are not acceptable most of the times because they affect the production phase. These systems need to be improved in order to provide correct detection and accurate response measures in order to decrease the risk and mitigate the threat. In case of fail disaster recovery and business continuity plans are in place to ensure that service delivery will not stop. The ENISA (European Network Information Security Agency) has produced recommendations for Europe and member states on how to protect Industrial Control Systems. The document describes the current state of Industrial Control System security and proposes seven recommendations for improvement. The recommendations call for the creation of national and pan-European ICS security strategies, the development of a Good Practices Guide on the ICS security. They would foster awareness and education, as well as research activities or the establishment of a common test bed and ICS-computer emergency response capabilities. [Kuipers and Fabro, 2006] provides guidance and direction for developing ‘defence-in-depth’ strategies for organizations that use control system networks while maintaining a multi-tier information architecture. Additionally, [Byres et al, 2008] state that companies need to deploy a “defence in depth” strategy, where there are multiple layers of protection, down to and including the control device.
[Phelan et al, 2007] presents a risk assessment methodology that accounts for both physical and cyber security. It also preserves the traditional security paradigm of detect, delay and respond, while accounting for the possibility that a facility may be able to recover from or mitigate the results of a successful attack before serious consequences occur. The methodology provides a means for ranking those assets most at risk from malevolent attacks. Because the methodology is automated the analyst can also play "what if with mitigation measures to gain a better understanding of how to best expend resources towards securing the facilities. It is simple enough to be applied to large infrastructure facilities without developing highly complicated models. Finally, it is applicable to facilities with extensive security as well as those that are less well-protected. Future research initiatives that should be addressed to ensure the grid maintains adequate attack resilience are introduced by [Govindarasu et al, 2012]. The developments of strong risk modelling techniques are required to help quantify risks from both a cyber and physical perspective. Improved risk mitigation efforts are also required focusing on both the infrastructure and application perspectives. Particularly, attack resilient control, monitoring, and protection algorithms should be developed to utilize increased system knowledge to reduce the impact from a successful attack. Risk information must also be provided to operators and administrators through the development of real-time situational awareness infrastructure, which can be integrated with current monitoring functions to assist in dissemination of cyber alerts and remedies, and the development of appropriate attack responses.
More modern approaches are based on the partnership between scientists and citizens. Participatory research has been previously used, in fact, internationally to involve local communities in data collection and monitoring or natural resources management research. [Roa and Brown, 2009] explore the involvement of youth in environmental research. The research took place in a small rural watershed in Colombia, the Los Sainos micro-watershed in the western cordillera of the Colombian Andes. The research was conducted in 2004 and 2005, and involved a total of 30 youth, with subgroups involved in specific themes. Youth from 9 to 17 years old were invited to participate in the project through the local schools and were involved in all aspects of the research including survey design, data collection, analysis and the presentation of results. Working with youth led, particularly interesting, to a raised awareness of environmental issues amongst the youth themselves and allowed them to raise awareness amongst their peers and adults in the local community. A significant aspect was the development of an approach to watershed assessment, which involved youth in all aspects of the research. This process was found to advance environmental education, and knowledge of research methods and local environmental impacts.
For data collection in particular, participatory sensing relies on electronic means widely available for collecting the data with the help of ordinary people. As mobile phones have evolved from devices that are just used for voice and text communication, to advanced platforms that are able to capture and transmit a range of data types (image, audio, and location), the adoption of these increasingly capable devices by society has enabled a potentially pervasive sensing paradigm - participatory sensing. A coordinated participatory sensing system engages individuals carrying mobile phones to explore phenomena of interest using in situ data collection. By enabling people to investigate previously difficult to observe processes with devices they use every day, participatory sensing brings the ideals of traditional community-based data collection and citizen science to an online and mobile environment, while offering automation, scalability, and real-time processing and feedback. In particular, in participatory sensing, individuals explicitly select the sensing modalities (they are in control of their privacy-related data) to use and what data to contribute to larger data collection efforts.
An example of a participatory sensing project in presented by [Sasank et al, 2011], where authors demonstrate the creation of participatory sensing campaigns using smartphones. One campaign, called “What's Bloomin”, deals with water conservation, by asking subjects to take geo-tagged photos of “blooming” flora. Having this inventory enables facilities to identify, using the plants, the water saturation within the soil, and draw conclusions as to when to replace high water usage plants with ones that are drought tolerant.
Other environmental / water-related applications include measuring pollution levels in a city, water levels in creeks, and/or monitoring wildlife habitats. Such applications enable the mapping of various large-scale environmental phenomena by involving the common person. An example prototype deployment is CreekWatch, developed by IBM Almaden Research Center [Kim, 2010]. It monitors water levels and quality in creeks by aggregating reports from individuals, such as pictures taken at various locations along the creek or text messages about the amount of trash. Such information can be used by water control boards to track pollution levels in water resources.
There are also several challenges we’ll need to tackle for participatory sensing. Finding a fit between diverse users and participatory sensing projects mirrors traditional selection for volunteer work based on interest and skill. But because participatory sensing is organized virtually / electronically, identifying best-suited particular participants (individuals who collect, analyze, and share their data) for campaigns (targeted data collection efforts) can be, thus far, only partially automated. Identification techniques for participants generally rely not only on participants' reputations as data collectors-based contribution habits, but also on participants' availability in the area of interest [Lu, 2011].
For encouraging participation, various reputation models have been proposed and used for participatory sensing. The simplest reputation models are ones that are summation and average based. They use an aggregation of ratings (i.e., by summing, as in case of eBay, or averaging, as in case of Amazon), to create an overall single reputation score. An alternative scheme to having reputations being a numerical value is to use discrete labels. For example, the Slashdot web site aggregates ratings on actions, such as story submissions, postings, moderation activities, into tiers for participants that include terrible, bad, neutral, positive, good, and excellent [Sasank et al, 2011].
Another challenge for participatory sensing comes from the dynamic conditions of the set of mobile devices. Data quality in terms of accuracy, latency, and confidence can change all the time due to device mobility, variations in their energy levels and communication channels, and device owners’ preferences. Identifying the right set of devices to produce the desired data and instructing them to sense with proper parameters to ensure the desired quality is a complex problem. Related to reputation is the need to understand human behaviour, as people are the carrier of the sensing devices, and their recruitment depends on their capability to correctly collect sending data. A variety of data mining and statistical tools can be used to distil information from the data collected by mobile phones and calculate summary statistics related to human behaviour recognition. Still, recognizing human behaviour is still a somewhat unsolved research direction, but thus far not many frameworks managed to successfully incorporate this aspect in the recruitment decisions.
An idea not yet fully explored, for the future, is to use participatory data as complementary to more-traditional sensor-based gathered information on water quality and water management processes. Reputation models for the data sources can, in theory, be constructed for this using distributed technologies based on blockchain and smart contracts - an interesting application of this technology for water supply. Furthermore, using blockchain as a secure decentralized database will enable scalability, privacy and consistency for shared data, open format exchange, end-to-end data transparency management, resilience to cyber-attacks, with faster transactions, lower maintenance costs, which improves efficiency.
7 Standards: INSPIRE and OGS
One of the most critical problems of hydroinformatics systems is the heterogeneity of the components. To solve them, specific standards describe how different components can inter-communicate, and how they can understand the exchanged messages.
This section presents two important approaches. INSPIRE Directive (May 2007) establishes an infrastructure for spatial information in Europe with the main aim to support community environmental policies, and policies or activities which may have an impact on the environment (see Section 6.1).
OGC (Open Geospatial Consortium) standards have a larger scope, being dedicated to the global geospatial community, and responding to the needs of many domains including Environment, Defense, Health, Agriculture, Meteorology, and Sustainable Development (see Section 6.2).
7.1 INSPIRE (INfrastructure for SPatial InfoRmation in Europe)
INSPIRE directive is based on the infrastructures for spatial information, which creates Spatial Data Infrastructure (SDI) procedures and methodologies), with key components specified through technical implementing rules, by addressing 34 spatial data themes (see Figure 30). INSPIRE requires the adoption of ‘Implementing Rules’ which set out how the system will operate. INSPIRE regulations require standardized metadata documentation for the data and the services.
INSPIRE provides access to location and properties as well as core vocabularies and unique identifiers for buildings, addresses, transport networks, utility and production facilities and all kinds of geographical, geophysical, statistical and environmental data related to such spatial features covering an area or location.
Figure 30. INSPIRE: 34 spatial data themes.
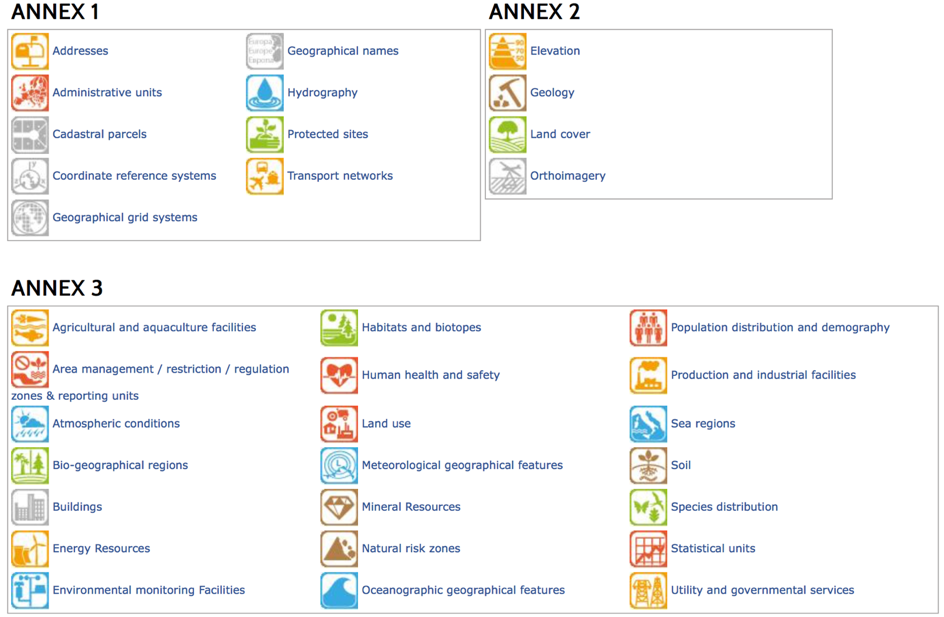
The hydrology applications that use INSPIRE has an internal schema that is divided into three separate application schemas mapped on physical waters (primarily for mapping purposes), network model (primarily for spatial analysis and modelling), management and reporting units. These schemas are defined with dependencies with spatial object types (see Figure 31). In this case, INSPIRE contributes through required publication in portal, access through network services, standardized metadata, up to data information significantly to re-users needs. According with 2015 INSPIRE Conference, it is used for the active dissemination and reporting of information related to legislation on urban waste water.
Figure 31. Package structure of the Hydrography application schemas.
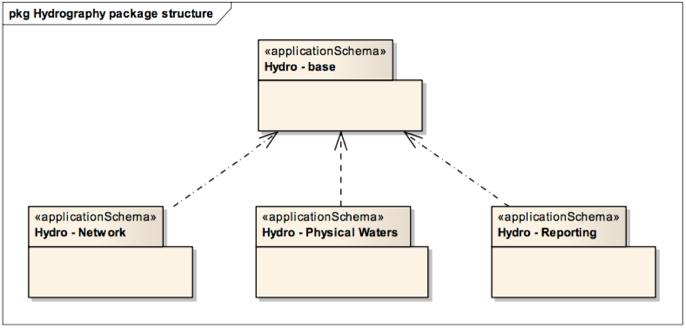
As a general model, the client applications access geospatial data stored in repositories through services in the middleware layer. Although SDI nodes may rely technologically on cyberinfrastructure to provide increased distributed hardware capacity for handling huge datasets, conceptually, the distributed GIS approach to SOA-based applications is perhaps best represented by the SDI paradigm, in which standardized interfaces are the key to allowing geospatial services to communicate with each other in an interoperable manner responding to the true needs of users [Granell, 2010].
7.2 OGC standards
OGC – Open Geospatial Consortium is an international not for profit organization involved in the elaboration of open standards for the global geospatial community. These standards describe interfaces or encodings used by software developers to build open products and services. In particular, OGC Web Services (OWS) standards are dedicated to Web applications.
For example, WMS (Web Map Service) delivers spatial data (maps) as images, WFS (Web Feature Services) provides maps as vector data (features), while WPS (Web Processing Service) is standard for geospatial processing, such as polygon overlays. SensorML (Sensor Model Language) can be used to describe a large variety of sensors and facilitate sensors discovery and geolocation, processing sensor observations, subscribe to sensor alerts or program the sensor.
WaterML (Water Markup Language) is used for standard representation of hydrological time series data in XML format, while GML (Geography Markup Language) does the same thing for geographical information. Such representations use the textual format and can be understood by human readers. They have behind schemas descriptions that can be used by programs to understand the semantics of data, and process these data without human intervention (the approach is called Semantic Web).
Some standards are combinations of different technologies. For example, the Semantic Sensor Web (SSW) combines sensors and Semantic Web technologies so that software services can access sensors and their observations. Also, the Semantic Sensor Network (SSN) ontology offers expressive representation of sensors, observations, and knowledge of the environment.
OGC is continuously elaborating new standards, many specifications being in phase of adoption by the OGC membership as official OGC standards.
OGC standards are based on client-server architectures. The REST (REpresentational State Transfer) architecture considers that the system is a collection of addressable resources (e.g. with URLs), each resource offering a specific Web service to clients. To invoke a service, the client sends a HTML message (GET, PUT, DELETE, POST) to a specific resource, which executes the software service and returns the actual state that is represented by the service’s result.
8 Priority areas, challenges and research directions in FP7 and H2020 projects
The evolution and the state of the art in Information and Communication Technologies for Water Management can be better understood in the context of European projects that contributed to its development. The elaboration of the ICT for Water Management roadmap, which describes the main gaps and challenges that need to be addressed in the future, has been initiated by the ICT4Water consortium and achieved with the contribution of 15 EU FP7 projects (see Section 7.1) and H2020 (see Section 7.2) active or finished projects. In the sequel we present some of the objectives, approaches, models, and technologies developed in these projects. The presentation is based on the information found on projects’ home pages mentioned in this section. We also described the Open Access Initiatives for EU (see Section 7.3).
8.1 FP7 projects
- EFFINET FP7 project
Efficient Integrated Real-time Monitoring and Control of Drinking Water Networks
Home page: http://effinet.eu/
Objective: the development of an integrated ICT based water resource management system aiming to improve the efficiency of drinking water use, energy consumption, water loss minimization, and water quality guarantees.
Topics: decision-support for real-time optimal control of water transport network, monitoring water balance, distribution network, management of consumer demand, remote control and data acquisition (SCADA and GIS systems), stochastic model predictive control algorithms, fault detection, diagnosis techniques, hydraulic and quality-parameter evolution models, smart metering techniques, forecasting of consumption patterns.
- ICeWater FP7 project
ICT Solutions for efficient Water Resources Management
Home page: http://icewater-project.eu/
Objective: increase the stability of freshwater supply to citizens in urban areas by adjusting the water supply to the actual consumption, while minimizing energy consumption.
Topics: wireless sensors, decision support systems, demand management, consumers’ awareness, dynamic pricing policies (mathematical approaches), customers’ behaviour, asset management, leakage detection and localization, consumption patterns, advanced optimization, simulation, predicting network deterioration, Internet of things, underground sensors and radio propagation.
- iWIDGET – FP7 project
Smart meters, Smart water, Smart societies
Home page: http://www.i-widget.eu/
Objective: improving water efficiencies through the developing, demonstrating and evaluating a fully integrated ICT-based system, which enables householders and water suppliers to understand and manage their demand and minimize wastage in the supply chain.
Topics: data mining, analytics, decision support, scenario modelling, data management, standards interfaces, visualization, water conservation modelling and social simulation, case studies, adaptive pricing, decision support systems, data management, advanced metering including combined water and energy metering, real-time communication, climate and energy.
- WatERP – FP7 project
Where water supply meets demand
Home page: http://www.waterp-fp7.eu/
Objective: develop a web-based “Open Management Platform” (OMP) supported by real-time knowledge on water supply and demand, enabling the entire water distribution system to be viewed in an integrated and customized way.
Topics: water consumption patterns, water losses, distribution efficiency, water supply and demand forecasts, web-based unified framework, data acquisition systems, Water Data Warehouse, open standards (WaterML 2.0), ontology, interoperability, usability, Decision Support System, water supply distribution chain, cost savings, Demand Management System, socio-economical drivers and policies, demand management, test and validation scenarios.
- UrbanWater – FP7 project
Challenges and benefits of an open ICT architecture for urban water management
Home page: http://urbanwater-ict.eu/
Objective: build a platform to enable a better end-to-end water management in urban areas.
Topics: advanced metering, real-time communication of consumption data, water demand forecasting, consumption patterns, authorities decision support, adaptive pricing and user empowerment, spatial tools, decision making, integrated UrbanWater platform.
- DAIAD – FP7 project
Open Water Monitoring
Home page: http://daiad.eu/
Objective: improving the management of water resources through real-time knowledge of water consumption, improve societal awareness, induce sustainable changes in consumer behaviour, and explore new water demand management strategies.
Topics: multi-point water consumption monitoring, consumer-oriented and intuitive knowledge delivery, Big data management and analysis for large scale, resource/ demand management strategies, data intensive problem, high quality data.
- ISS-EWATUS – FP7 project
Integrated Support System for Efficient Water Usage and Resources Management
Home page: http://issewatus.eu/
Objective: development of an intelligent Integrated Support System for Efficient WATer USage and resources management.
Topics: data interpretation and presentation to consumers, mobile devices, Decision Support System, social-media platform, water-saving behaviour, users’ awareness, reducing leaks in water delivery, adaptive pricing policy, system validation, flexible exploitation in any EU location, training manuals.
- SmartH2O – FP7 project
Smart metering, water pricing and social media to stimulate residential water efficiency
Home page: http://www.smarth2o-fp7.eu/
Objective: develop an ICT platform to understand and model the consumers’ current behaviour, based on historical and real-time water usage data.
Topics: social awareness incentives, models of user behaviour, quantitative data, dynamic pricing policies, agent-based simulation model, modular and scalable ICT platform, water demand management policies, resource efficiency, use cases, millions of users.
- Waternomics – FP7 project
Interactive water services
Home page: http://waternomics.eu/
Objective: provide personalized and actionable information about water consumption and water availability to individual households, companies and cities, in an intuitive and effective manner, at a time-scale relevant for decision-making.
Topics: personalized interaction with water information services, knowledge transfer, sharing of water information, generic water information services, geological, environmental and social environments, open (collaborative) business models, flexible pricing mechanisms, sensors, water meters, leakage detection, fault detection, water awareness games, software platform.
- WISDOM – FP7 project
Water analytics and intelligent sensing for demand optimized management
Home page: http://wisdom-project.eu/
Objective: developing and testing an intelligent ICT system that enables "just in time" actuation and monitoring of the water value chain from water abstraction to discharge, in order to optimize the management of water resources.
Topics: ICT framework, real-time and predictive water management, Water Decision Support Environment, user awareness, behaviours concerning the use of water, peak-period, resource efficiency, business operations of water utilities, environmental performance of buildings, semantic approach, holistic water management, computer aided decision making, data sharing, integrated water infrastructure, interfacing with other smart infrastructures.
8.2 H2020 projects
- WaterInnEU – H2020 project
Applying European market leadership to river basin networks and spreading of innovation on water ICT models, tools and data
Home page: http://www.waterinneu.org/
Objective: create a marketplace to enhance the exploitation of EU funded ICT models, tools, protocols and policy briefs related to water and to establish suitable conditions for new market opportunities based on these offerings.
Topics: standardization, interoperability, open virtual marketplace, success stories, trans-national river basin, water management, benchmarking, regulation and management of water systems and services.
- KINDRA – H2020 project
Knowledge Inventory for hydrogeology research
Home page: http://www.kindraproject.eu/
Objective: take stock of Europe’s contemporary practical and scientific knowledge of hydrogeology research and innovation with the help of an inventory of research results, activities, projects and programmes, and then use the inventory to identify critical research challenges and gaps, with a view to avoiding overlaps.
Topics: Water Framework Directive, groundwater, European Federation of Geologists, Joint Panel of Experts, EU Groundwater Associations, Networks and Working Groups, community involvement and dissemination, relevance of groundwater in daily life.
- FREEWAT – H2020 project
FREE and open source software tools for WATer resource management
Home page: http://www.freewat.eu/
Objective: promoting water resource management by simplifying the application of the Water Framework Directive and other EU water related Directives.
Topics: software modules, water management, GIS, application, participatory approach, relevant stakeholders, designing scenarios, water policies, open source platform, enhancing science, evidence-based decision making,
- BlueSCities – H2020 project
Making water and waste smart
Home page: http://www.bluescities.eu/
Objective: develop the methodology for a coordinated approach to the integration of the water and waste sectors within the 'Smart Cities and Communities' EIP (European Innovation Partnership on Smart Cities and Communities).
Topics: smart city, SIP Smart Cities and Communities, sustainability of water management in a city, assess current situation, case studies, Blue City Atlas, recommendations, practical guidance, research and technological work, practical training courses, city governors, policy orientation.
- WIDEST – H2020 project
Water Innovation through Dissemination Exploitation of Smart Technologies
Home page: http://www.widest.eu/
Objective: establish and support a thriving and interconnected Information and Communication Technology (ICT) for the Water Community with the main objective of promoting the dissemination and exploitation of the results of European Union (EU) funded activities in this area.
Topics: ICT for Water Observatory, Common Dissemination Frameworks, Semantic Interoperability and Ontologies, Smart City Connection, Smart Water Grids.
8.3 Open Access Initiatives for EU
Open access is an important practice for European research, as new rules state "Under Horizon 2020, each beneficiary must ensure open access to all peer-reviewed scientific publications relating to its results” (extract from a typical Research Grant). This means it has to become a practice of providing on-line access to scientific information that is free of charge to the reader. Open Access does not interfere with the protection of research results such as, but not limited to, patenting, and therefore with their commercial exploitation. It should be noted, however, that patent publications are not considered Open Access dissemination, since the latter only refers to publication in peer-reviewed scientific journals.
European Commission sees Open Access not as an end in itself but as a tool to facilitate and improve the circulation of information and transfer of knowledge in the European Research Area (ERA) and beyond. The Commission adopted the ERA Communication entitled “A Reinforced European Research Area Partnership for Excellence and Growth” . The ERA is a unified research area open to the world based on the Internal Market, in which researchers, scientific knowledge and technology circulate freely. One of the key actions foreseen to achieve this goal is to optimize the circulation, access to and transfer of scientific knowledge.
The 2012 Recommendation on access to and preservation of scientific information (2012/417/EU) was part of a package that outlined measures to improve access to scientific information produced in Europe and to bring them in line with the Commission's own policy for Horizon 2020. Although still considered a very valuable and impactful tool for policymaking, the Recommendation has been revised in the context of the recast of the Public Sector Information Directive (PSI) to reflect developments in practices and policies in open science and in view of the preparation of the next Framework Programme for Research and Innovation (Horizon Europe).
The new Recommendation C (2018) 2375, adopted on April 25th, 2018, now explicitly reflects developments in areas such as research data management (including the concept of FAIR data i.e. data that is Findable, Accessible, Interoperable and Re-usable), Text and Data Mining (TDM) and technical standards that enable re-use incentive schemes. It reflects ongoing developments at the EU level of the European Open Science Cloud, and it more accurately considers the increased capacity of data analytics of today and its role in research. It also clearly identifies as two separate points the issue of reward systems for researchers to share data and commit to other open science practices on the one hand, and skills and competences of researchers and staff from research institutions on the other hand.
In this framework, today EU puts a great emphasis on the governance and the funding of an Open Science Cloud. The Commission has already decided to make scientific data generated in Horizon 2020 open by default, through a European Commission 'European Cloud initiative', issued in April 2016, which sets a very ambitious vision for the European Open Science Cloud; it draws a clear roadmap and set concrete commitments for the Commission to make this vision a reality by 2020. The Commission appointed a High-Level Expert Group on the European Open Science Cloud to advise on the scientific services to be provided on the cloud and on its governance structure. The initiative reinforces Open Science, Open Innovation and Open to the world policies. It will foster best practices of global data findability and accessibility (FAIR data), help researchers get their data skills recognized and rewarded (careers, altmetrics); help address issues of access and copyright (IPR) and data subject privacy; allow easier replicability of results and limit data wastage e.g. of clinical trial data (research integrity); contribute to clarification of the funding model for data generation and preservation, reducing rent-seeking and priming the market for innovative research services e.g. advanced TDM (new business models).
The European Open Science Cloud (EOSC) is a vision for a federated, globally accessible, multidisciplinary environment where researchers, innovators, companies and citizens can publish, find, use and reuse each other's data, tools, publications and other outputs for research, innovation and educational purposes. Making this vision a reality is essential to empower Europeans to tackle the global challenges ahead. The EOSC is one of five broad policy action lines of the European open science agenda endorsed also by the EC Communications on the Digital Single Market (DSM) strategy.
During 2016, the Directorate-General for Research and Innovation of the EC set up the Open Science Policy Platform (OSPP), a high-level expert advisory group having the mandate to support the development and implementation of the open science policy in Europe. The selected 25 experts belonging to different stakeholder groups are called to tackle the following different dimensions of open science: reward system, measuring quality and impact (altmetrics), changing business models for publishing, FAIR open data, European Open Science Cloud, research integrity, citizen science, open education and skills.
The EOSC is expected to grow into a federated ecosystem of organisations and infrastructures from different countries and communities. As such, it poses a number of challenges in different areas: 1) Governance structure and principles: to identify the distribution of rights and responsibilities among the different entities in the EOSC ecosystem and rules for making decisions; 2) Financial schemes: to shape the best financial mechanisms that can enable the EOSC ecosystem to flourish and deliver value in an efficient way; 3) Other relevant areas: awareness, skills development and ethics.
In the context of Data4Water, the first Pilot on Open Research Data included explicitly data on „marine and maritime and inland water research” . The result is an Open Research Data Pilot (OpenAIRE) publically availble, containing Accessible Research results.
Figure 32. The repository contains over 33.900 records of Openly Accessible research data on Water Management alone (as of July 2018).
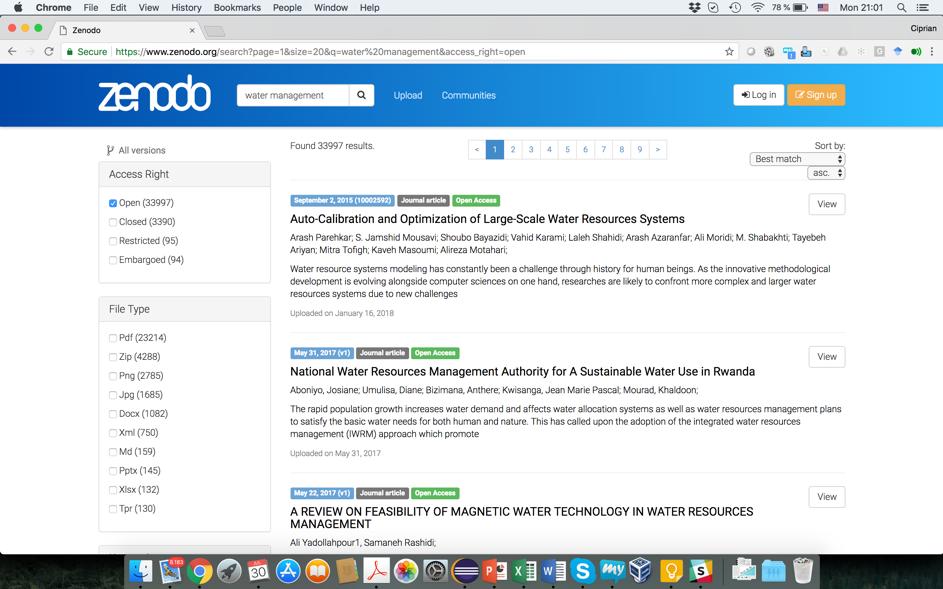
In parallel with that, the INSPIRE Directive aims to create a European Union spatial data infrastructure for the purposes of EU environmental policies and policies or activities which may have an impact on the environment (highly relevant for the direction of Data4Water). This European Spatial Data Infrastructure is set to enable the sharing of environmental spatial information among public sector organisations, facilitate public access to spatial information across Europe and assist in policy-making across boundaries. INSPIRE is based on the infrastructures for spatial information established and operated by the Member States of the European Union. The Directive addresses 34 spatial data themes needed for environmental applications. The Directive came into force on 15 May 2007 and is implemented in various stages, with full implementation required by 2021.
8.4 Other projects
EOMORES project Copernicus platform
Earth Observation-Based Services for Monitoring And Reporting Of Ecological Status (EOMORES) and is a water quality monitoring project initiated in 2017 by a group of researchers who were previously involved in different smaller initiatives of water quality data gathering such as FRESHMON (FP7, 2010-2013), GLaSS (FP7, 2013-2016), CoBiOS (FP7, 2011-2013), GLoboLakes (UK NERC,
2012-2018), INFORM (FP7, 2014-2017). Many of these projects were funded by the European Unions Seventh Framework Programme for Research and Technological Development (FP7) and dealt with satelite data analysis in the monitoring of quality requirements imposed by the EU directives. The purpose of EOMORES project is different scale monitoring on water bodies, combining a series of techniques in order to obtain comprehensive results which can pe further used in an efficient manner.
The first technique is based on satellite monitoring and is providing a set of data from Copernicus Sentinels every few days, depending on the availability of the Sentinels, or the weather conditions. The data provided is then converted into information by one or several algorithms which have been previously tested against a wide range of factor (location, type of water, sensor technical characteristics). For the project research, EOMORES is collaborating with six countries (Italy, France, The Netherlands, the UK, Estonia, Lithuania and Finland), having different latitude coordinates for their location and also belonging to very different climates/ecoregions.
The main focus of the observations was the comparison of different approaches to atmospheric correction (the process of removing the effects of the atmosphere on the reflectance values of images taken by satellite or airborne sensors [COPERNICUS Homepage, 2018]). Satellite data has the advantage of covering large areas, but the drawback is that they have limited levels of detail achievement and measurement frequency. EOMORES uses Sentinel-1, Sentinel-2 and Sentinel-3 from Copernicus programme which offers free and open data. The first launch of Earth Observation satellites for Copernicus happened in 2014 and one year after, they have improved their assets by launching Sentinel-2A which was aimed to provide color vision data for changes on the surface of the Earth [COPERNICUS Homepage, 2018]. This mean that its optical system included three spectral bands in the electromagnetic spectrum area also called red-edge in which the difference is plant reflectance (visible light absorbed by plants versus radiation scattered in the photosynthesis).
The second technique consists of in situ observations or in situ monitoring which provides continuous measurements of a specific location in an assigned period of time (e.g 24 hours). This is information collected directly on site and is meant to be complementary or validating of the satellite data. As this kind of observations is not influenced so much of the weather state, the level of control over the frequency of measurement is higher. EOMORES researchers use hand-held devices for in situ data collecting, but an autonomous fixed-position optical instrument is in development as an improvement of the current Water Insight Spectrometer (WISP). This instrument is used for measuring Chlorophyll, Phycocyanin and Suspended sediments which are measures of algal biomass/cyanobacterial biomass/total suspended matter (TSM) [EOMORES-H2020 Homepage, 2018]. The measured values appear on the display in 30-90 seconds. The raw information can be uploaded from the WISP to a cloud-platform for further analysis, model generation and further computation. The WISP has incorporated three cameras which are able to break light into its spectral components. By comparing the three sources which measure light coming straight into the WISP and the light reflected from the surface of the water, a derivation of the parameters wanted is being done through band-ratio algorithms.
The third technique is modelling which combines the results obtained through the two techniques previously presented in order to generate prediction data, forecast information on the specified area.
All the reliable quality water datasets are to be transformed in sustainable commercial services offered to international or national/regional authorities which are in charge of monitoring water quality or are responsible with water management and environmental reporting. Private entities that deal with the same monitoring issues can benefit from the data collected and mined by the EUMORES researchers.
AquaWatch project
AquaWatch project (2017-2019) is part of the GEO (Group on Earth Observation) Water Quality Initiative whose aim is to build a global water quality information service. The implementation of the project, currently in progress, is based on activity distribution across working groups, each with a specific focus element.
AquaWatch has a targeted public which consists of science and industrial communities, Non-Governmental Organizations, policy maker, environmental organization managers, non-profit organizations. Also, access to information will be promoted to simple recreational users too. These potential end-users are to be attracted and involved as volunteers in the working groups or for gathering data. In the beginning of 2018, a first group of products should be finished. This group would contain products which support turbidity measurement using different techniques:
a Secchi disk [Preisendorfer, 1986] depth product which is a plain, circular disk 30 cm diameter for measurement of water transparency or turbidity in bodies in water;
a diffuse attenuation coefficient product;
a Nephelometric Turbidity Unit product;
a surface reflectance product.
SmartWater4Europe project
Smart Water For Europe is a demonstration project that is being created to produce business cases for Smart Water Networks (SWN). Founded by the European Union, the project will try to demonstrate optimal water networks and will look at the potential to integrate new smart water technologies across Europe. European organizations are taking part in the project and four demonstration sites are available -Vitens (the Netherlands), Acciona (Spain), Thames (UK), Lille (France).
The project will help to understand how small technologies can deliver costeffective performance and improve the water supply service given to customers. Smart water technologies and hi-tech informatics will allow the early detection of leaks on a 24/7 basis leading towards Smart Networks through data capture, analysis and reporting. As well as leakage detection, service excellence will be supported with best practices as energy monitoring, water quality and customer engagement. The main idea of the project is to implement small projects, receive recommendations based on the implementation and then go on with another small project in a different location, across Europe and beyond.
Vitens Inovation Playground (The Netherlands) is a demonstration site which consists of 2300 km of distribution network, serving around 200.000 households. Conductivity, temperature, chlornation level are measured using hi-tech sensors. Pipe burst detection and water hammer detection is tested through Syrinix sensors. Using an integral ICT solution, all the dynamic data from sensors, but also static data formats such as area photos, distribution network plans or soil maps, are stored and made available for water companies participating in the project and for researchers. The Vitens Inovation Playground serves also as a training facility in which operators learn how to respond to high risk incidents like contamination or massive leakages.
Smart Water Innovation Network in the city of BurGos (Spain) is working with three different hydraulic sectors (one industrial, one urban and one residential) which have been converted into one Smart Water Network. To create it, a network of quality sensors and conventional water meters with electronic versions equipped with communication devices have been installed. The information provided by the sector flow meters is integrated into the end-to-end management system, the so-called Business Intelligence Platform. This platform, hosted in the Big Data Center manages and processes the data gathered from common management systems, integrating also the algorithms developed in order to automatically detect leaks, predict consumption levels and check the quality of the water at any moment. The platform information is also used for continuously improving the overall service. The ultimate objective is to find the key parameters of the smart supply network so that the service could be implemented in any location, regardless of its characteristics. Among the benefits of such projects is the chance of savings of millions of dollars all over the world.
Thames Water Demo Site (The Netherlands) focuses on trunk mains leak detection by being aware of transients or rapid changes in pipe pressure and taking proactive action about the specific incidents. In addition, a first attempt has been made to distinguish between customer side leakage and wastage through a scalable algorithm which has been trained on smart meter data. In order to promote good practices, customers have been given incentives to save money and earn discounts by using water more carefully. An energy visualization tool was built in order to show where the energy on the network is being distributed. This graphic tool helps users better understand the dependency between demand, pressure and energy. All the solutions are concentrated in a single interface in order to display relevant information for operators to act or to discover causeeffect connections.
OPC UA with MEGA model architecture
The authors of [Robles, 2015] identify the problem of interoperability in water management initiatives, caused by the lack of support and lack of standardization in the monitoring processes, as well as the control equipment. They propose a smart water management model which combines Internet of Things technologies and business coordination for having better outcomes in decision support systems. Their model is based on the OPC US (Object Linking and Embedding for Process Control Unified Architecture) which is an independent platform that offers service-oriented possibilities of architecture schemes for controlling processes which are part of the manufacturing or logistic fields. The platform is based on web service technologies, therefore being more flexible to scenarios of usage.
The proposed model is MEGA model which takes into consideration functional decoupled architectures in order to achieve the goal of increased interoperability between the water management solutions on which companies and organizations are currently working. This would also solve the problem of SME (Small and Medium-sized Enterprise) companies locally oriented which provide good local solutions for water management, but which have difficulties in expanding to other countries, regions, or to maintain their funding on a long-term.
The MEGA architecture consists of several layers, the main ones being the following:
Management and Exploitation layer hosts the main applications and services (can be executed in cloud, on local hosts) and supports the management definitions of the processes;
Coordination layer defines and can associate, if necessary, entities to physical objects, collects the procedures defined by the ME layer and delivers them to the Subsystem layer after associating sequence of activities to them (recipes);
Subsystem layer contains the subsystems that execute, independently or not, the procedures and recipes defined in the Coordination layer;
Administration layer provides a user interface for administration and monitoring, enables configuration of entities defined in previous layers.
The water management model proposed includes a Physical Model and a Process Model which contain several Process Cells, Units, Units Procedures, Control Modules, Equipment Modules and Operations which can be handled differently, according to the business requirements. The big steps of the whole Mega Model process are as follows:
Identifiers Mapping map recipe identifier to subsystem identifier (if the recipe is already provided, if not, translate the instructions into a standard recipe first);
Recipe validation check if the subsystem is able to execute the process
contained in the recipe;
Process transfer to the suitable subsystem each subsystem receives its sequence of activities to be executed;
Control and monitoring of the process execution information about the ongoing processes can be monitored in real-time.
WATER-M project
WATER-M project is an international initiative of representatives from four countries (Finland, France, Romania and Turkey), part of the Smart City challenge. The project is meant to contribute to a major upgrade of the water industry by helping with the introduction and integration of novel concepts such as GIS (Geographic Information System) usage, ICT with IoT applications or real-time data management or monitoring. The final purpose is to build a unified water business model targeted at European Union water stakeholders. Through operational control and monitoring real-time data, the WATER-M project is currently developing a service-oriented approach and event driven mechanisms for dealing with the water sustainability problem.
As the project was started in 2017, the plans and results are made public once progress is made. The use cases defined for this initiative are stated below [ITEA3 Homepage, 2018]:
Leak Detection;
Development of Water Management and Flood Risk Prevention Platform;
River Tele-monitoring;
Performance monitoring of water distribution network;
Control and optimization of the water distribution network;
Coordinated management of networks and sanitation structures;
New redox monitoring;
Urban Farming.
Energy cost reduction and compatibility with European directives on water for allowing new business models for water management to emerge on the basic structure of the WATER-M are taken into consideration. Critical challenges, as well as options for various communication protocols such as LTE-M or LoRa, or AMR (Automatic Meter Reading) technologies with benefits and drawbacks were discussed in a state-of-the art [Berhane, 2015] aimed at evaluating the previous proposals in the areas of water management. A new model has not yet been proposed, it is still work in progress.
8.5 Smart city water management available technologies
GIS (Geographic Information System)
A GIS system can be viewed as a database, which comprises all geometric elements of the geographical space with specific geometric accuracy together with information i. e. in tabular form which is related to geographic location. The GIS is associated by a set of tools, which do data management, processing, analysis and presentation of results for information and related geographic locations. The geographical space can be viewed as composed of overlaid planes of information over a wider geographical area and each plane has specific information or features [Hatzopoulos, 2002].
The different planes contain similar geographic features. For example, one plane has elevations, another plane can have the drainage features represented, while another can have the rainfall. Thematic maps are then created, using map algebra on plane information [Gorgan, 2010], [Petcu, 2007], [Pop, 2007].
All the features in GIS are viewed as objects which can further be used to build models. The simplest object is a point object than the complex/composed objects such as lines or areas rely on the point objects.
The up-to-date GIS technology can use data stored in warehouses or databases, accessing it through internet and running the GIS system every time, the specific datasets change. This is a feature usually used to have reliable real-time hydrological models for forecasting systems. Further developments on GIS technology is aimed at integrating object-oriented programming techniques, therefore ordering components into classes. An example of a component may be a line segment of a river and the data contained in such a class can represent coordinates, length values, profile dimensions or procedures for computing the river flow at a specific moment.
Water management could use GIS systems for basic data such as creating a national hydrology dataset which is permanently updated, but also for hydrologic derivatives which can be used together with satellite data and in situ information for dealing with prevention, management of water shortage or better organizing cities and rural areas.
IBM Water Management Platform
IBM Water Management Platform is a Big Data Cloud platform offered by IBM for implementation of solutions which can help end-users or organizations in several forms, regarding environmental or direct water problems. The set of features offered by the problem can be summarized in : provide situational awareness of operations integrate data from almost any kind of source (GIS, ERP-Enterprise Resource Planning, satellite, on site data-photo, video, numerical) form patterns and correlations, visualize graphically contextual relationships between systems run and monitor SOPs(Standard Operation Procedures) from dashboards no compatibility adjustments needed when adding or removing devices set up business rules for generating alerts in risky situations compare current and historical data to discover patterns or cause-effect relations
IBM Intelligent Water solutions offer multiple deployment models to provide options for cities of all sizes with varying levels of IT resources. Cities with robust IT capabilities or strong interests in behind-the-firewall implementation can deploy this solution in their own data centers. Alternatively, deploying IBM Intelligent Water on the IBM Smart-Cloud can help cities capitalize on the latest technology advances while controlling costs [IBM Intelligent Water, 2018].
Also, the personalized views are used by different so-called role-given-users for efficient analysis. The platform offers Citizen View (for water track usage in households), Operator View (for events, assets on geospatial maps), Supervisor View (for trends against KPI-key performance indicators) and Executive View (tracking and communicating KPI updates).
IBM Intelligent Water products are currently used in the Digital Delta system in the Netherlands which analyses data to forecast and prevent floods in the country, while the city of Dubuque (United States) uses the IBM platform for sustainable solutions in household water consumption, monitoring infrastructure leakages and reducing water waste.
TEMBOO platform - IoT Applications
Temboo is a software toolkit available directly from the web browser which enables anyone to access hard technologies like APIs (Application Programming Interfaces) and IoT(Intrnet of Things). Temboo users have access to data through public and private APIs and can develop their own IoT applications, starting from the services offered by the platform.
Developers would use what Temboo calls choreos to build together an application that is triggered from inputs registering on the IoT ARTIK device. Choreos are built out of APIs and act like microservices that perform one specific function that might be made available through an API. By splitting an APIs functionality into microservices using the choreos format, code snippets can be kept short and reduce memory requirements and processing power on the device itself, while also enabling more complex server-side processing to be undertaken in the cloud [Mark Boys, Temboo API Platform, 2018]. Hardware development kits, embedded chipsets, sensors and data from sensors, actuators and remote control of actuators, M2M communication frameworks, and gateway/edge architectures can be integrated into Temboo. It generates editable pieces of software code which is in a standardized form, partitioned in production-ready blocks, easy to implement with the aid of cloud services.
Temboo offers lightweight SDKs, libraries, and small-footprint agents for programming every component: MCUs (C SDK/Library, Java Embedded (in progress) ), SoCs/gateways (Python Agent with MCU, Java Agent with MCU, Python SDK, Java SDK), Mobile Applications (iOS SDK, Android SDK, Javascript SDK). For connecting devices to the cloud services, Temboo supports BlueTooth, Ethernet, WiFi and GSM (in progress).
Temboo can generate code for complete multi-device application scenarios, in which edge devices use a common IoT communications protocol to send Temboo requests through a gateway. The gateway handles all communication with Temboo, enabling local edge devices to interact with the huge range of web-based resources supported by Temboo [TEMBOO Homepage, 2018]. The protocols used for M2M (Machine to Machine) communications are MQTT, CoAP or HTTP.
Message Queuing Telemetry Transpor t(MQTT) is an standard for publishsubscribe-based messaging protocols. It works on top of the TCP/IP protocol and is used for connections with remote locations with constraints for network bandwidth [Hunkeler, 2008].
Constrained Application Protocol (CoAP) [Shelby, 2014] is a service layer protocol well-suited internet device, such as wireless sensor network nodes which are resource limited. This protocol enables nodes to communicate through Internet using similar protocols. It is also used with other mechanisms, like SMS on mobile communication networks.
A series of pre-build applications are provided which are demonstrated on a small scale but can be also used for large scale problem. One of those applications is a Water Management for monitoring and remotely controlling the water level in a tank. This includes a mobile alert send to the user in case of action needed to be taken on the water tank level.
RoboMQ
RoboMQ is a Message Queue as Service platform hosted on cloud and available as an Enterprise hosting option. This Software as a Service (SaaS) platform is an integrated message queue hub, analytics engine, management console, dashboard and monitoring & alerts; all managed and hosted in a secure, reliable and redundant infrastructure” [ROBOMQ Homepage, 2018].
The key features that the platform offers are:
Scalability(auto-scalable through any load balancing and scaling)
Expandability (it can be integrated in application or other features/functions can be added to it) Reliability (messages are persistent and durable)
Monitoring through dashboards, analytic tools and specific alerts
Compatible with different protocols (MQTT, AMQP (Advanced Message Queueing Protocol), STOMP (Simple Text Oriented Messaging Protocol), HTTP/REST)
Support for multiple programming languages (all the libraries supporting the protocols above are supported by RoboMQ e.g Phyton, Java, .NET) –
Secured connections (supports SSL (secure socket layer) connection for all available protocols)
RoboMQ acts as a message broker, managing queues between a producer and a consumer. Given its expandability feature, it has been integrated in an IoT Analytics application which collects data from various sensors, sends it to the queues managed by RoboMQ. The data is redirection to a IoT listener which then writes in a specific real-time database. All the data can be monitored through dashboards, panel metrics and graphs in real-time.
RoboMQ provides M2M integration through an open standard based platform to connect devices and sensors to the back-end applications, systems or processes. The protocols supported by RoboMQ (MQTT, STOMP, AMQP) can run on very small footprint devices using one of the languages that are supported by the device OS and profile. Among the devices that can be used are: Raspberry Pi, Audrino, Beaglebone and mBed based platforms. These devices will have the role of producer, sending the data as messages through to the RoboMQ broker, while the consumer will be the RoboMq dashboard application.
9 Further research directions
This section presents, in a compact form, future research directions in ICT4Water resulted from the state of the art section correlated with priority areas of HORIZON 2020. The main current directions of Hydroinformatics to properly manage the problems of aquatic environment are mentioned here.
Water related subjects
- River/urban flood forecasting and management
- Reservoir operations
- Water supply management (Drinking water, Industry, Irrigation)
- Water and energy efficiency in water distribution networks
- Ecology and Water quality (Wastewater, Environmental flows, Drinking water)
Research directions
- Water management solutions that consider synergies across sectors: nexus not only between water and energy, but also with other aspects in Smart Cities land, food, climate change, and smart home ecosystems; need contributions in:
- monitoring systems
- predictive models and tools
- analytical methods to handle climate uncertainty
- user access to modelling results
- high performance decision support
- Improved solutions for social perceptions of water
- adaptive pricing strategies, legal and policy challenges
- Reduced total cost of ownership for Water ICT
- accurate monitoring and understanding of water use, demand and related risks
- cost-effective technical solutions addressing sensing, analysis, engagement
- business models with energy consumption monitoring,
- improved leakage detection technologies
- analysis (understanding TCO/benefit ratio)
- Increase interoperability by the use of standards for
- data formats, vocabularies, procedures,
- metadata – centralized metadata catalogue
- software (API)
- Decision Support Systems – comparability between implementations (technologies, algorithms)
- common frameworks and KPIs for objective assessment of improvements
- Measure results in the application of ICT for water management
- define new indicators related to water management.
- Improvement of the Data4Water services
- integrated information-centric system will facilitate the conversion of data to knowledge; the process integrates the hydrological information with the economics, political and social disciplines
- participatory citizen science for water management will improve water quality monitoring, expand data collection, improve the statistical power of data sets, facilitate the observation of difficult to quantify phenomena, proliferation of citizen science, etc.
- anomaly detection on smart sensors data used in water management
- anonymity protection of data sources that share and interact around content and information on mobile and web-based platforms; data anonymization targets the privacy protection of data sources
- extend the Cloud to IoT, for optimizing the managing of data for water by rapidly, near to source processing data or analyzing and sending it to other IoTs and/or Cloud
- allow exchange and combination of data from heterogeneous domains through mechanisms that support the interoperability of cross-domain applications.
10 References
“ICT for Water” Roadmap (2014 and 2015): https://ec.europa.eu/digital- agenda/en/news/ict-water-resources-management-experts-consultation- 4022014, http://ec.europa.eu/newsroom/dae/document.cfm?doc_id=9672
Othman, Mazliza, Sajjad Ahmad Madani, and Samee Ullah Khan. "A survey of mobile cloud computing application models." IEEE Communications Surveys & Tutorials 16, no. 1 (2014): 393-413.
Abernethy, R. B., R. P. Benedict, and R. B. Dowdell. "ASME measurement uncertainty." Journal of Fluids Engineering 107, no. 2 (1985): 161-164.
Abudu, Shalamu, J. Phillip King, and A. Salim Bawazir. "Forecasting monthly streamflow of Spring-Summer runoff season in rio grande headwaters basin using stochastic hybrid modeling approach." Journal of Hydrologic Engineering 16, no. 4 (2010): 384-390.
Standard, A. I. A. A. Assessment of wind tunnel data uncertainty. AIAA S-071-1995, Washington DC, 1995.
Allen, James F., and George Ferguson. "Actions and events in interval temporal logic." In Spatial and temporal Reasoning, pp. 205-245. Springer Netherlands, 1997.
Anicic, Darko, Paul Fodor, Nenad Stojanovic, and Roland Stühmer. "Computing complex events in an event-driven and logic-based approach." In Proceedings of the Third ACM International Conference on Distributed Event-Based Systems, p. 36. ACM, 2009.
Assumpção, Thaine H., et al. "Citizen observations contributing to flood modelling: opportunities and challenges." Hydrology and Earth System Sciences 22.2 (2018): 1473-1489.
Bean, Howard Stewart, ed. Fluid meters: Their theory and application. Vol. 2. American Society of Mechanical Engineers, 1971.
Chiu, Bill, Eamonn Keogh, and Stefano Lonardi. "Probabilistic discovery of time series motifs." In Proceedings of the ninth ACM SIGKDD international conference on Knowledge discovery and data mining, pp. 493-498. ACM, 2003.
Ballweber, Jeffery A. "A comparison of IWRM frameworks: the United States and South Africa." Journal of Contemporary Water Research & Education 135, no. 1 (2006): 74-79.
Berk, Richard A. Regression analysis: A constructive critique. Vol. 11. Sage, 2004.
Blass, W. E., and P. B. Crilly. "An introduction to neural networks based on the feed forward, backpropagation error correction network with weight space limiting based on a priori knowledge." In Instrumentation and Measurement Technology Conference, 1992. IMTC'92., 9th IEEE, pp. 631-634. IEEE, 1992.
Buishand, T. Adri, and Theo Brandsma. "Multisite simulation of daily precipitation and temperature in the Rhine basin by nearest‐neighbor resampling." Water Resources Research 37, no. 11 (2001): 2761-2776.
Li, Cheng, Daniel Porto, Allen Clement, Johannes Gehrke, Nuno Preguiça, and Rodrigo Rodrigues. "Making geo-replicated systems fast as possible, consistent when necessary." In Presented as part of the 10th USENIX Symposium on Operating Systems Design and Implementation (OSDI 12), pp. 265-278. 2012.
Mayfield, Chris, Jennifer Neville, and Sunil Prabhakar. "ERACER: a database approach for statistical inference and data cleaning." In Proceedings of the 2010 ACM SIGMOD International Conference on Management of data, pp. 75-86. ACM, 2010.
Matos, Rafaela, Adriana Cardoso, P. Duarte, R. Ashley, Alejo Molinari, and Andreas Schulz. "Performance indicators for wastewater services-towards a manual of best practice." Water science and technology: water supply 3, no. 1-2 (2003): 365-371.
Lakshman, Avinash, and Prashant Malik. "Cassandra: a decentralized structured storage system." ACM SIGOPS Operating Systems Review 44, no. 2 (2010): 35-40.
Chakravarthy, Sharma, and Raman Adaikkalavan. "Ubiquitous nature of event-driven approaches: a retrospective view." In Dagstuhl Seminar Proceedings. Schloss Dagstuhl-Leibniz-Zentrum für Informatik, 2007.
Chakravarthy, Sharma, Vidhya Krishnaprasad, Eman Anwar, and Seung-Kyum Kim. "Composite events for active databases: Semantics, contexts and detection." In VLDB, vol. 94, pp. 606-617. 1994.
Chandrasekaran, Sirish, and Michael J. Franklin. "Streaming queries over streaming data." In Proceedings of the 28th international conference on Very Large Data Bases, pp. 203-214. VLDB Endowment, 2002.
Zhang, Changkuan, and Hongwu Tang. Advances in Water Resources & Hydraulic Engineering: Proceedings of 16th IAHR-APD Congress and 3rd Symposium of IAHR-ISHS. Springer Science & Business Media, 2010.
Chattopadhyay, Surajit, and Goutami Chattopadhyay. "Univariate modelling of summer-monsoon rainfall time series: comparison between ARIMA and ARNN." Comptes Rendus Geoscience 342, no. 2 (2010): 100-107.
Chen, S. M., Y. M. Wang, and I. Tsou. "Using artificial neural network approach for modelling rainfall–runoff due to typhoon." Journal of Earth System Science 122, no. 2 (2013): 399-405.
Coleman, Hugh W., and W. Glenn Steele. Experimentation, validation, and uncertainty analysis for engineers. John Wiley & Sons, 2009.
Damle, Chaitanya, and Ali Yalcin. "Flood prediction using time series data mining." Journal of Hydrology 333, no. 2 (2007): 305-316.
Peng, Daniel, and Frank Dabek. "Large-scale Incremental Processing Using Distributed Transactions and Notifications." In OSDI, vol. 10, pp. 1-15. 2010.
Dasgupta, Sourish, Satish Bhat, and Yugyung Lee. "Event Semantics for Service Composition in Pervasive Computing." In AAAI Spring Symposium: Intelligent Event Processing, pp. 27-34. 2009.
Diamantopoulos (2008) - Diamantopoulos A., Riefler P., Roth, K.P., 2008. Advancing formative
Dinh, Hoang T., Chonho Lee, Dusit Niyato, and Ping Wang. "A survey of mobile cloud computing: architecture, applications, and approaches." Wireless communications and mobile computing 13, no. 18 (2013): 1587-1611.
Dionysios Logothetis, Chris Trezzo, Kevin C. Webb, and Kenneth Yocum. In-situ MapReduce for log processing. In USENIX ATC, 2011.
Elnahrawy and B. Nath. Cleaning and querying noisy sensors. In WSNA, pages 78–87, 2003
EIP on Smart Cities and Communities: http://ec.europa.eu/eip/smartcities/
EIP on Water: http://www.eip-water.eu/
Engle, Cliff, Antonio Lupher, Reynold Xin, Matei Zaharia, Michael J. Franklin, Scott Shenker, and Ion Stoica. "Shark: fast data analysis using coarse-grained distributed memory." In Proceedings of the 2012 ACM SIGMOD International Conference on Management of Data, pp. 689-692. ACM, 2012.
Chu, Y. Wang, S. Parker, and C. Zaniolo. Data cleaning using belief propagation. In IQIS, pages 99–104, 2005.
Fread, D.L., (1975). “Computation of Stage-Discharge Relation-ships Affected by Unsteady Flow”. Water Resources Bulleting, 11(2), 213-228
French N (1992) - French, M. N., Krajewski, W. F., and Cuykendal, R. R. (1992). “Rainfall forecasting in space and time using a neural network. ‘‘ J. Hydrol., Amsterdam, 137, 1–37.
DeCandia, D. Hastorun, M. Jampani, G. Kakulapati, A. Lakshman, A. Pilchin, S. Sivasubramanian, P. Vosshall, and W. Vogels, “Dynamo: amazon’s highly available key-value store,” in Proceedings of twenty- first ACM SIGOPS symposium on Operating systems principles, ser. SOSP ’07. New York, NY, USA: ACM, 2007, pp. 205–220.
Ghorbani (2010) - Ghorbani, M.A., Khatibi, R., Aytek, A., Makarynskyy, O. and Shiri, J., 2010. Sea water level forecasting using genetic programming and comparing the performance with artificial neural networks. Computers & Geosciences, 36(5), pp.620-627.
Global Risk (2015) - World Economic Forum, “The Global Risks Report 2015”, http://reports.weforum.org/global-risks-2015/part-1-global-risks-2015/environment-high-concern-little-progress/
Goyal (2010) - Goyal, M.K. and Ojha, C.S.P., 2010. Analysis of mean monthly rainfall runoff data of Indian catchments using dimensionless variables by neural network. Journal of Environmental Protection, 1(02), p.155.
Granell, Carlos, Laura Díaz, and Michael Gould. "Service-oriented applications for environmental models: Reusable geospatial services." Environmental Modelling & Software 25, no. 2 (2010): 182-198.
GUM (1993). “Guide to the Expression of Uncertainty in Measurement”, ISBN 92-67-10188-9, BIPM, IEC, IFCC, ISO, IUPAC, IUPAP, OIML, International Organization for Standardization, Geneva, Switzerland.
GWP (2004). Catalyzing change: A handbook for developing integrated water resources management (IWRM) and water efficiency strategies. Global Water Partnership, Elanders, Svensk Information, Stockholm, Sweden. Available at http://www.unwater.org/downloads/Catalyzing_change-final.pdf (accessed on 21 January 2013).
H.-E. Chihoub, S. Ibrahim, G. Antoniu, and M. S. Pe ́rez-Herna ́ndez, “Harmony: Towards automated self-adaptive consistency in cloud storage,” in 2012 IEEE International Conference on Cluster Com- puting (CLUSTER’12), Beijing, China, 2012, pp. 293–301.
Herlihy, Daniel R., Bruce F. Hillard, and Timothy D. Rulon. "National Oceanic and Atmospheric Administration Sea Beam System 'Patch Test'." The International Hydrographic Review 66, no. 2 (2015).
Huayong Wang, Li-Shiuan Peh, Emmanouil Koukoumidis, Shao Tao, and Mun Choon Chan. Meteor shower: A reliable stream processing system for commodity data centers. In IPDPS ’12, 2012.
Huiqun (2008) - Huiqun, M. and Ling, L., 2008, December. Water quality assessment using artificial neural network. In 2008 International Conference on Computer Science and Software Engineering (pp. 13-15). IEEE.
IDNR, Proposals for the creation of watershed management authorities, Iowa Department of Natural Resources, Des Moines, Iowa.
INSPIRE Directive: http://inspire.ec.europa.eu/
ISO (1967). ISO/R541 “Measurement of Fluid Flow by Means of Orifice Plates and Nozzles”, International Organization for Standardization, Geneva, Switzerland.
ISO (1997). ISO/TR 8363 “Measurement of Liquid Flow in Open Channels – General Guidelines for Selection of Method”, International Organization for Standardization, Geneva, Switzerland.
Chakrabarti, E. Keogh, S. Mehotra, and M. Pazzani. Localy adaptive dimensionality reduction for indexing large time series databases. TODS, 27(2), 2002.
K.W. Chau (2007) - Chau, Kwok-Wing. "An ontology-based knowledge management system for flow and water quality modelingmodelling." Advances in Engineering Software, Vol. 38, No. 3, pp. 172-181, 2007
Karnouskos, Stamatis, and Armando Walter Colombo. "Architecting the next generation of service-based SCADA/DCS system of systems." IECON 2011-37th Annual Conference on IEEE Industrial Electronics Society. IEEE, 2011.
Kastner, K., Hoitink, A.J.F., Vermeulen, B., Hydayat, Sassi, M.G., Pramulya, and Ningsih, N.S. (2015). “Comparison of discharge estimates from a rating curve and ADCP measure-ments”, Proceedings 36th IAHR World Congress, 28 June-3 July, 2015, The Hague, the Netherlands.
Krutov, Ilya, Gereon Vey, and Martin Bachmaier. In-memory Computing with SAP HANA on IBM eX5 Systems. IBM Redbooks, 2014.
Le Coz J. (2014). “A literature review of methods for estimating uncertainty associated with stage-discharge relations”, Progress Report for the Word Meteorological Organization project “Assessment of the Performance of Flow Measurement Instrumentation and Techniques” January 14, 2014
Le Coz, J., Blanquart, B., Pobanz, K., Dramais, G., Pierrefeu, G., Hauet, A. and Despax, A. (2015). “Estimating the uncertainty of streamgauging techniques using field interlaboratory experiments,” J. Hydraulic Engineering, under review.
Lee, K. N. (1993). Compass and gyroscope: Integrating science and politics for the environment. Washington, DC: Island Press.
Levesque, V.A., and K.A. Oberg (2012), Computing discharge using the index velocity method. U.S. Geological Survey Techniques and Methods, 3–A23, 148. available online at http://pubs.usgs.gov/tm/3a23.
Lowry, C. S. and Fienen, M. N.: CrowdHydrology: crowdsourcing hydrologic data and engaging citizen scientists, Ground Water, 51, 151–156, https://doi.org/10.1111/j.1745-6584.2012.00956.x, 2013.
Zaharia, “An Architecture for Fast and General Data Processing on Large Clusters,” p. 128, 2014.
Zaharia, M. Chowdhury, T. Das, and A. Dave, “Resilient distributed datasets: A fault-tolerant abstraction for in-memory cluster computing,” NSDI’12 Proc. 9th USENIX Conf. Networked Syst. Des. Implement., pp. 2–2, 2012.
Zaharia, T. Das, H. Li, T. Hunter, S. Shenker, and I. Stoica, “Discretized streams: fault-tolerant streaming computation at scale,” Sosp, no. 1, pp. 423–438, 2013.
Mackay, E.B., Wilkinson, M.E., MacLeod, C.J.A., Beven, K., Percy, B.J., Macklin, M.G., Quinn, P.F., Stutter, M., Haygarth, P.M., (2015). “Digital catchment observatories: A platform for engagement and knowledge exchange between catchment scientists, policy makers, and local communities,” Water Resources Research, 51, pp. doi: 10.1002/2014WR016824; 4815-4822.
Maier (1996) - Maier, H.R. and Dandy, G.C., 1996. The use of artificial neural networks for the prediction of water quality parameters. Water Resour Res, 32(4), pp.1013-1022.
Marmorek, D. R. and Murray, C. (2003). Adaptive management and ecological restoration. In Friederici, P. (ed.) Ecological restoration of Southwestern ponderosa pine forests, pp. 417–428. Flagstaff, AZ: Ecological Restoration Institute.
Measurement models, Journal of Business Research, Vol. 61, pp. 1203-1218.
Michelsen, N., et al. "YouTube as a crowd-generated water level archive." Science of the Total Environment 568 (2016): 189-195.
Mirzoev, Timur, and Craig Brockman. "SAP HANA and its performance benefits." arXiv preprint arXiv:1404.2160 (2014).
Missbach, Michael, Thorsten Staerk, Cameron Gardiner, Joshua McCloud, Robert Madl, Mark Tempes, and George Anderson. "SAP and the Internet of Things." In SAP on the Cloud, pp. 139-151. Springer Berlin Heidelberg, 2016.
Mühl, G., Fiege, L., & Pietzuch, P. (2006). Distributed Event-Based Systems. Springer 2006.
Muste M. and Lee K. (2013). “Quantification of Hysteretic Be-havior in Streamflow Rating Curves”. Proceedings of the 35 IAHR World Congress, September 8 -13, Chengdu, China.
Muste, M and Cheng, Z. (2015). “Assessment of the Accuracy of Streamflow gauging Stations on Snake River,” Report for Idaho Power Company, Boise, ID
Muste, M. (2012). Information-centric systems for underpinning sustainable watershed resource management, Water Quality and Sustainability, 21 pp. 270-298
Muste, M. (2014). “Information-Centric Systems for Underpinning Sustainable Watershed Resource Management,” Chapter 13 in “Comprehensive Water Quality and Purification,” Ahuja S. (Ed), vol 4, Elsevier, pp. 270-298.
Muste, M., Kim, D., Arnold, N., et al. (2010). Digital watershed inception using community project components. Proceedings of Institution of Civil Engineers – Water Management 163(1), 13–25.
Muste, M., Lee, K. and Bertrand-Krajewski, J-L. (2012). “Standardized Uncertainty Analysis Frameworks for Hydrometry: Review of Relevant Approaches and Implementation Examples,” Hydrological Sciences Journal, available on line; doi:10.1080/0262667.2012.675064.
Muste, M., Z. Cheng, J. Hulme, and P. Vidmar (2015), Consider-ations on discharge estimation using index-velocity rating curves, Proceedings of the 35 IAHR World Congress, June 28 – July 3, Delft – The Hague, the Netherlands.
Nayak (2006) - Nayak, P.C., Rao, Y.S. and Sudheer, K.P., 2006. Groundwater level forecasting in a shallow aquifer using artificial neural network approach. Water Resources Management, 20(1), pp.77-90.
NCS - National Communications System, Supervisory Control and Data Acquisition (SCADA) Systems, Technical Information Bulletin NCS TIB 04-1 (2004), Arlington, Virginia.
O'Callaghan, J. R. "NELUP: an introduction." (1995): 5-20.
OGC. Web Processing Service - http://www.opengeospatial.org/standards/wps
Indyk, N. Koudas, and S. Muthukrishnan. Identifying represen tative trends in massive time series data sets using sketches. In VLDB, 2000.
Pangare, V., Pangare, G., Shah, V., Neupane, B. R. and Rao, S. (2006). Global perspectives on integrated water resources management: A resource kit. New Delhi, India: Academic Foundation.
Paschke, A. (2008) Design Patterns for Complex Event Processing, In Proceedings of the 2nd International Conference on Distributed Event-Based Systems (DEBS'08), Rome, Italy, 2008, Retrieved 15 Januaruy 2010 from http://arxiv.org/ftp/arxiv/papers/0806/0806.1100.pdf.
Perumal, M. and Raju, R. (1999). “Approximate convection-diffusion equations” J. Hydrologic Engn., 4(2), pp. 160-164.
Pilon, P.J., Fulford, J.M., Kopaliani, Z., McCurry, P.J., Ozbey, N., Caponi, C. (2007). “Proposal for the Assessment of Flow Measurement Instruments and Techniques”, Proceedings XXXII IAHR Congress, Venice, Italy.
Plattner, Hasso, and Alexander Zeier. In-memory data management: technology and applications. Springer Science & Business Media, 2012.
Puccinelli, Daniele, and Martin Haenggi. "Wireless sensor networks: applications and challenges of ubiquitous sensing." Circuits and Systems Magazine, IEEE 5, no. 3 (2005): 19-31.
Agrawal, C. Faloutsos, and A. N. Swami. Efficient similarity search in sequence databases. In FODO, 1993.
Aversa, B. Di Martino, M. Ficco, and S. Venticinque. Simulation and Support of Critical Activities by Mobile Agents in Pervasive and Ubiquitous Scenarios. 10th IEEE Int. Symp. on Parallel and Distributed Processing with Applications (ISPA 2012), Leganes, Madrid, 10-13 July 2012, pp. 815-822. IEEE CS Press.
Raadgever, G. T., Mostert, E. and van de Giesen, N. C. (2006). Measuring adaptive river basin management. In: Colosimo, M. and Potts, D. F. (eds.) Proceedings of the AWRA 2006 Summer Specialty Conference ‘Adaptive Management of Water Resources’. Middleburg, VA: American Water Resources Association (AWRA).
Rantz, S.E. and others., (1982). “Measurement and computation of streamflow”. US Geological Survey Water Supply Paper 2175, 1, 2.
Roland P. (2005) - Donald Knight, Asaad Shamseldin "River Basin Modelling for Flood Risk Mitigation" CRC Press, Nov 17, 2005
Ruhl, C.A., and M.R. Simpson (2005), “Computation of dis-charge using the index-velocity method in tidally affected are-as”. U.S. Geological Survey, Scientific Investigations Report 2005-5004, Reston, VA.
Ghemawat, H. Gobioff, and S.-T. Leung, “The Google file system,” SIGOPS - Operating Systems Review, vol. 37, no. 5, pp. 29–43, 2003.
Papadimitriou, A. Brockwell, and C. Faloutsos. Adaptive, unsupervised stream mining. VLDB J., 13(3), 2004.
Savenije, H. H. G. and Hoekstra, A. Y. (2002). Water resources management. In knowledge for sustainable development: An insight into the encyclopedia of life support systems, vol. II, pp. 155–180. Paris, France: UNESCO Publishing/Oxford, UK: EOLSS Publishers.
Schmidt A. R., (2002). “Analysis of stage-discharge relations for open channel flows and their associated uncertainties”. Ph.D. Thesis, U of Illinois at Urbana-Champaign, Champaign, IL
Sikka, Vishal, Franz Färber, Wolfgang Lehner, Sang Kyun Cha, Thomas Peh, and Christof Bornhövd. "Efficient transaction processing in SAP HANA database: the end of a column store myth." In Proceedings of the 2012 ACM SIGMOD International Conference on Management of Data, pp. 731-742. ACM, 2012.
Simonovic, S. (2009). Managing water resources. Paris, France: UNESCO Publishing.
Smith, C.F., Cordova, J.T. and Wiele, S.M. (2010). “The contin-uous slope-area method for computing event hydrographs”, U.S. Geological Survey Scientific Investigation Report 2010-5241, Reston, VA, 37p.
Song, T. and W. H. Graf (1996), “Velocity and turbulence distri-bution in unsteady open-channel flows”, J. Hydraul. Eng., 122(3), 141-154, doi: 10.1061/(ASCE)0733-9429(1996)122:3(141)
Sreekanth (2012) - Sreekanth, J. and Datta, B., 2012. Genetic programming: efficient modelingmodelling tool in hydrology and groundwater management.
Stanford, 2016- Stanford CS class - Convolutional Neural Networks for Visual Recognition url: http://cs231n.github.io/neural-networks-1/. Last access May 2016
Starkey, E., Parkin, G., Birkinshaw, S., Large, A., Quinn, P., and Gibson, C.: Demonstrating the value of community- based (“citizen science”) observations for catchment modelling and characterisation, J. Hydrol., 548, 801–817, https://doi.org/10.1016/j.jhydrol.2017.03.019, 2017.
Ide and K. Inoue. Knowledge discovery from heterogeneous dynamic systems using change-point correlations. In SDM, 2005.
Talei (2010) - Talei, A., Chua, L.H.C. and Wong, T.S., 2010. Evaluation of rainfall and discharge inputs used by Adaptive Network-based Fuzzy Inference Systems (ANFIS) in rainfall–runoff modelingmodelling. Journal of Hydrology, 391(3), pp.248-262.
Tanty R. (2015) -Tanty, Rakesh, and Tanweer S. Desmukh. "Application of Artificial Neural Network in Hydrology-A Review." International Journal of Engineering Research and Technology. Vol. 4. No. 06, June-2015. ESRSA Publications, 2015.
TCHME (2003). “Annotated Bibliography on Uncertainty Analysis”, Task Committee on Experimental Uncertainty and Measurement Errors in Hydraulic Engineering, EWRI, ASCE, Available on line at: http://www.dri.edu/People/Mark.Stone/Tchme/task.html
Tyler Akidau, Alex Balikov, Kaya Bekiroglu, Slava Chernyak, Josh Haberman, Reuven Lax, Sam McVeety, Daniel Mills, Paul Nordstrom, and Sam Whittle. MillWheel: Fault-tolerant stream processing at internet scale. In VLDB, 2013.
Tyson Condie, Neil Conway, Peter Alvaro, and Joseph M. Hellerstein. Map- Reduce online. NSDI, 2010.
Walker, D., Forsythe, N., Parkin, G., and Gowing, J.: Filling the observational void: scientific value and quantitative validation of hydrometeorological data from a community-based monitoring programme, J. Hydrol., 538, 713–725, https://doi.org/10.1016/j.jhydrol.2016.04.062, 2016.
Wan, Jiangwen, Yang Yu, Yinfeng Wu, Renjian Feng, and Ning Yu. "Hierarchical leak detection and localization method in natural gas pipeline monitoring sensor networks." Sensors 12, no. 1 (2011): 189-214.
Wang (2006) - Wang, W., Van Gelder, P.H., Vrijling, J.K. and Ma, J., 2006. Forecasting daily streamflow using hybrid ANN models. Journal of Hydrology, 324(1), pp.383-399.
WATERS, (2008), Water and Environmental Research Systems Network, Science Plan, National Science Foundation, Reston, VA, USA
Williams, B. K., Szaro, R. C. and Shapiro, C. D. (2007). Adaptive management: The U.S. department of interior technical guide. Washington, DC: Adaptive Management Working Group, U.S. Department of Interior.
WISE – The Water Information System for Europe: http://water.europa.eu/
WMO (2007). “Exploratory Meeting on CHy’s Proposal for the Assessment of the Performance of Flow Measurement Instruments and Techniques,” 04/25-27/2007 Meeting Final Report, (available at: http://www.wmo.int/pages/prog/hwrp/FlowMeasurement.html), World Meteorological Organization, Geneva, Switzerland.
WMO (2008). “Guide to Hydrological Practices,” Commission for Hydrology, WMO-No 168, Sixth edition, World Meteorological Organization, Geneva, Switzerland, available on line at: http://www.whycos.org/hwrp/guide/index.php.
Wu X. (2014) - Wu, Xindong, Xingquan Zhu, Gong-Qing Wu, and Wei Ding. "Data mining with big data." Knowledge and Data Engineering, IEEE Transactions on 26, no. 1 (2014): 97-107
Xin, Reynold S., Joseph E. Gonzalez, Michael J. Franklin, and Ion Stoica. "Graphx: A resilient distributed graph system on spark." In First International Workshop on Graph Data Management Experiences and Systems, p. 2. ACM, 2013.
Xu, H., Hameed, H., Shen, B., Demir, I., Muste, M., Stevenson, M.B. and Hunemuller, T. (2016). “Prototype Decision Support System for Interjurisdictional Collaboration in Water Resource Management,” August 21-26, 2016, Hydroinformatics Conference, Incheon, Korea.
Zhang, N. Meratnia, and P. Havinga. Outlier detection techniques for wireless sensor networks: A survey. IEEE Communications Survey & Tutorials, 12(2), 2010.
Yoon (2011) - Yoon, H., Jun, S.C., Hyun, Y., Bae, G.O. and Lee, K.K., 2011. A comparative study of artificial neural networks and support vector machines for predicting groundwater levels in a coastal aquifer. Journal of Hydrology, 396(1), pp.128-138.
Zaheer (2003) - Zaheer, I. and Bai, C.G., 2003. Application of artificial neural network for water quality management. Lowl Technol Int, 5(2), pp.10-15.
Zhengping Qian, Yong He, Chunzhi Su, ZhuojieWu, Hongyu Zhu, Taizhi Zhang, Lidong Zhou, Yuan Yu, and Zheng Zhang. Timestream: Reliable stream computation in the cloud. In EuroSys ’13, 2013.
A. Ostfeld, "Enhancing Water-Distribution System Security through Modeling.", Journal of Water Resource Planning Management, 10.1061/ (ASCE) 0733-9496, vol:132, no:4, pp.209-210, 2006.
C. Copeland and B. A. Cody, “Terrorism and security issues facing the water infrastructure sector”, 2005.
P. H. Gleick, “Water and terrorism”, Journal Water Policy, vol: 8, pp.481–503, 2006.
D. Kuipers, M. Fabro, “Control Systems Cyber Security: Defense in Depth Strategies”, INL, U.S. Department of Energy National Laboratory, Battelle Energy Alliance, 2006.
E. Byres, P. Eng. J. Lowe, “The Myths and Facts behind Cyber Security Risks for Industrial Control Systems”, British Columbia Institute of Technology, 2008.
J. Phelan, P. Sholander, B. Smith, “Risk assessment for physical and cyber-attacks on critical infrastructures”, J. Depoy, Sandia Nat. Labs., Albuquerque, NM, 2007, USA.
Manimaran Govindarasu, Adam Hahn, Peter Sauer, “Cyber-Physical Systems Security for Smart Grid”, University of Illinois at Urbana-Champaign, PSERC, May 2012.
Garcia, CE Roa, and S. Brown. "Assessing water use and quality through youth participatory research in a rural Andean watershed." Journal of Environmental Management, vol:90, no:10, pp. 3040-3047, 2009.
Reddy, Sasank, Deborah Estrin, and Mani Srivastava. "Recruitment framework for participatory sensing data collections." Pervasive Computing. Springer Berlin Heidelberg, pp.138-155, 2010.
Kim, Sunyoung, et al. "Creek watch: pairing usefulness and usability for successful citizen science." Proceedings of the SIGCHI Conference on Human Factors in Computing Systems. ACM, 2011.
Lu, Hong, et al. "Bubble-sensing: Binding sensing tasks to the physical world." Pervasive and Mobile Computing, vol:6, no:1, pp. 58-71, 2010.
Dan Huru and Catalin Leordeanu and Elena Apostol and Valentin Cristea. BigClue: Towards a generic IoT cross-domain data processing platform. Published 2018 IEEE 14th International conference on Intelligent Computer Communication and Processing, ICCP, hold September 6-9, 2018 in Cluj-Napoca, Romania.
Andrei Dincu and Elena Apostol and Catalin Leordeanu and Mariana Mocanu and Dan Huru. Real-time processing of Heterogeneous Data in Sensor-based Systems. Published 2016 by IEEE in Proceedings of 10th International Conference on Complex, Intelligent, and Software Intensive Systems (CISIS), pp 290-295.
Ciolofan, Sorin N., Aurelian Draghia, Radu Drobot, Mariana Mocanu, and Valentin Cristea. "Decision support tool for accidental pollution management." Environmental Science and Pollution Research Volume 25, no. 7 (2018), pp 7090-7097. ISSN: 0944-1344, DOI: 10.1007/s11356-017-1028-5, IF 2,8
Ciolofan, Sorin N., Gheorghe Militaru, Aurelian Draghia, Radu Drobot and Monica Dragoicea, "Optimization of Water Reservoir Operation to Minimize the Economic Losses Caused by Pollution" DOI 10.1109/ACCESS.2018.2879571, IEEE Access (2018). IF 3.557
Ciolofan, SN; Mocanu, M.; Cristea, V., Cloud based large scale multidimensional cubic spline interpolation for water quality estimation, University Politehnica of Bucharest Scientific Bulletin Series C-Electrical Engineering and Computer Science, Volume 79, Issue 2, Pages 25-36, Published: 2017, ISSN: 2286-3540, eISSN: 2286-3559
GWP (2004). Catalyzing change: A handbook for developing integrated water resources management (IWRM) and water efficiency strategies. Global Water Partnership, Elanders, Svensk Information, Stockholm, Sweden. Available at http://www.unwater.org/downloads/Catalyzing_change-final.pdf (accessed on 21 January 2013).
Jollymore, Ashlee, Morgan J. Haines, Terre Satterfield, and Mark S. Johnson. "Citizen science for water quality monitoring: Data implications of citizen perspectives." Journal of environmental management 200 (2017): 456-467.
Computing, Fog. "the Internet of Things: Extend the Cloud to Where the Things are." Cisco White Paper (2015).
Gyrard, Amelie, Martin Serrano, and Pankesh Patel. "Building interoperable and cross-domain semantic web of things applications." In Managing the Web of Things, pp. 305-324. 2017.